
Investment Thesis
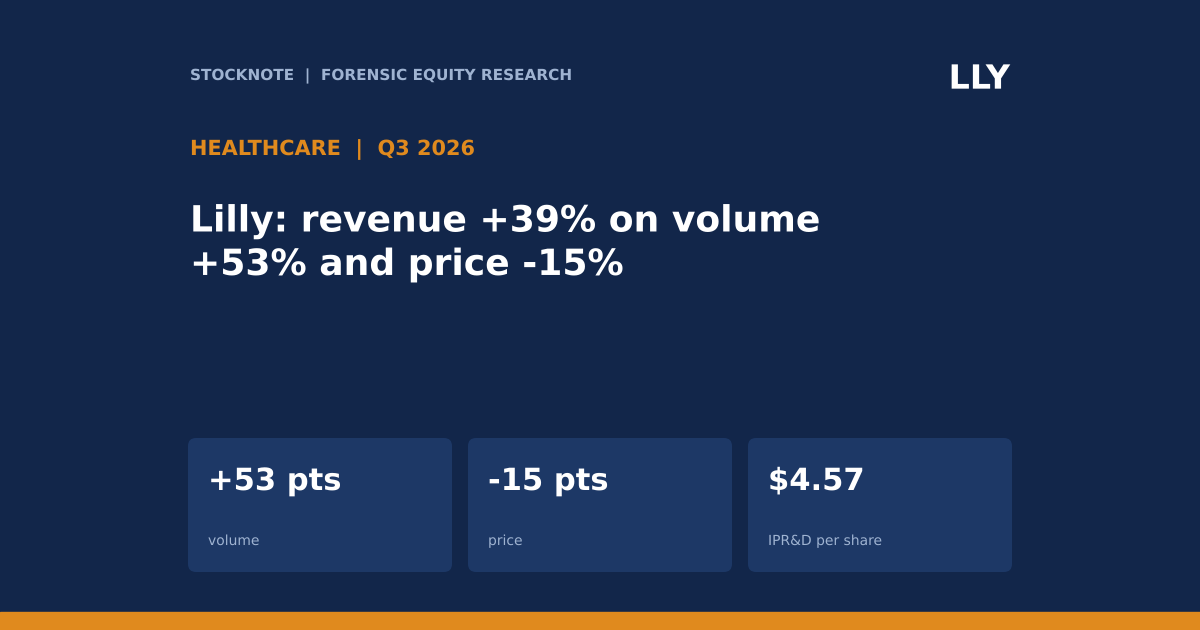
Eli Lilly reported third-quarter 2026 revenue of $24.4 billion, up 39%. The company's own growth decomposition is what makes the quarter instructive: volume added 53 percentage points and price subtracted 15. Reported EPS was $7.22 and non-GAAP EPS $7.48, after acquired in-process research and development (IPR&D) charges of about $4.2 billion, or about $4.57 per share. Full-year revenue guidance was raised to $91 billion to $92 billion from $85 billion to $87 billion. Source caution: I could not open Lilly's own release. These figures come from two secondary summaries (ChemXplore and 247WallSt), so treat them as unverified until checked against Lilly's filing.
- Revenue. $24.4B, +39%; volume +53%, price -15%; US $15.1B (+34%); international $9.3B (+47%).
- Earnings. Reported EPS $7.22; non-GAAP EPS $7.48; IPR&D $4.18B to $4.2B (about $4.57 per share).
- Other items. About $900M of other benefits, including a $410M Jardiance milestone. A China reimbursement-list price effect is cited.
- Guidance. 2026 revenue $91B to $92B (previously $85B to $87B).
- Not in my sources. Product-level splits and 2026 EPS guidance.
- This article contains no rating, price target or investment advice. Derived figures are marked (d).
Bottom line. Lilly's growth is a volume story with falling prices, which is the pattern of a product category expanding into more patients while each unit earns less. For investors the useful measure is not the headline growth but how much of the volume comes at a lower price, how much profit survives the research charges, and whether guidance rises with the quarter's strength. Guidance rose by about $5.5 billion at the midpoint (d).
Sources (secondary): ChemXplore; 247WallSt.
Q3 2026 At A Glance
| Q3 2026 | Value |
|---|---|
| Revenue | $24.4B (+39%) |
| Volume / price contribution | +53% / -15% |
| US / international revenue | $15.1B (+34%) / $9.3B (+47%) |
| Reported EPS / non-GAAP EPS | $7.22 / $7.48 |
| IPR&D charges | $4.18B to $4.2B (about $4.57 per share) |
| Other benefits incl. Jardiance milestone | about $900M incl. $410M |
| 2026 revenue guidance | $91B to $92B (was $85B to $87B) |
Sources (secondary): ChemXplore; 247WallSt.
What The Market Believes vs. What The Data Actually Shows
| Belief | What the data show |
|---|---|
| Price pressure is hurting the franchise | Price subtracted 15 points, but volume added 53, so net revenue growth was 39%. |
| Reported EPS of $7.22 shows the earnings power | IPR&D charges of about $4.57 per share depressed it; before them EPS would be about $11.79 (d). |
| Growth is a US phenomenon | International revenue grew 47% against 34% for the US, and the international share is 38% of revenue (d). |
| The beat is all organic | About $900M of other benefits, including a $410M Jardiance milestone, are in the quarter. |
| Guidance changes are small | Revenue guidance rose about $5.5B at the midpoint (d), or 6% above the old midpoint (d). |
Forensic #1: Price Versus Volume
| Contribution to Q3 revenue growth | Points |
|---|---|
| Volume | +53 |
| Price | -15 |
| Other (d) | +1 |
| Total | +39 |
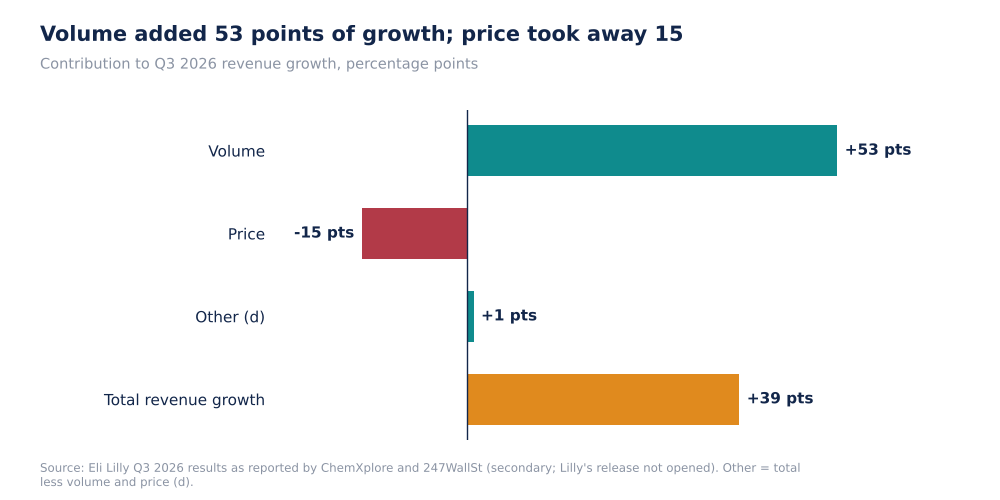
Lilly Q3 2026 Revenue Growth: Volume, Price And Total (Self-Made, d)
The components are additive contributions measured against last year's revenue, so +53 and -15 give +38, and the remaining point to +39 is other items (d), which may include currency. They are not compounding rates. Prior-year revenue was about $17.6 billion (d: $24.4B / 1.39). A 15-point price contribution therefore removed about $2.6 billion (d: 15% x $17.6B) of revenue, while volume added about $9.3 billion (d: 53% x $17.6B).
Why it matters. When prices fall and volumes expand, the key question is elasticity: does each point of price cut bring more than a point of volume? Here 15 points of price came alongside 53 points of volume, a ratio of about 3.5 to 1 (d), which is favourable. It does not prove that the price cuts caused the volume, since the extract says the China reimbursement-list change is one source of the price effect and other drivers may have raised volume independently.
Sources (secondary): ChemXplore; 247WallSt. Dollar effects are my arithmetic (d).
Forensic #2: Geography
| Region | Q3 2026 revenue | Growth | Share (d) | Prior-year revenue (d) |
|---|---|---|---|---|
| US | $15.1B | +34% | 62% | $11.3B |
| International | $9.3B | +47% | 38% | $6.3B |
| Total | $24.4B | +39% | 100% | $17.6B |
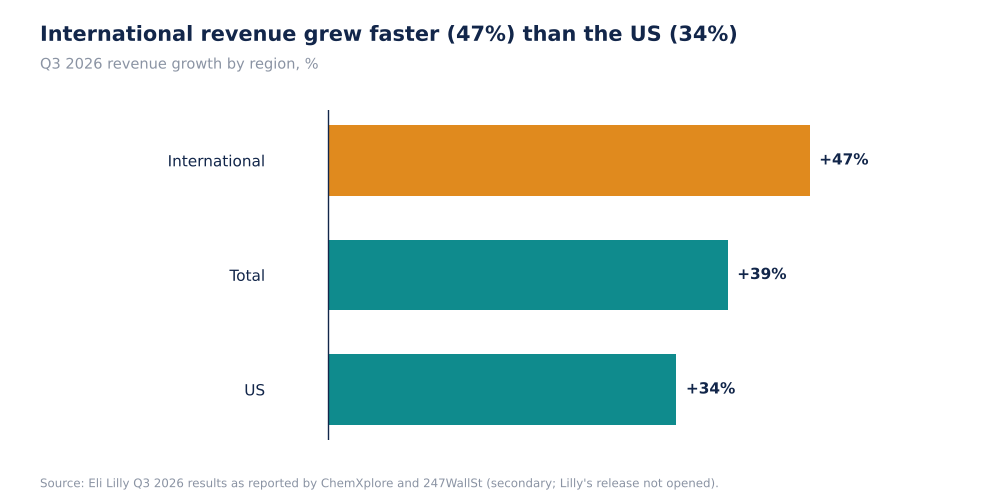
Lilly Q3 2026 Revenue Growth By Region (Self-Made, Secondary Data)
International revenue rose by about $3.0 billion (d: $9.3B less $6.3B) against about $3.8 billion (d) for the US, so the US still contributed more dollars. Of the $6.8 billion total increase (d), 56% came from the US (d) and 44% from international (d). The cited China reimbursement-list price effect sits in the international line, but the extract does not give its size.
Why it matters. International growth at 47% is faster than the US, but it is the more exposed to price resets of the kind named for China. The price component (-15 points) is not split by region in my sources.
Sources (secondary): ChemXplore; 247WallSt. Derived figures marked (d).
Forensic #3: Earnings Quality And IPR&D
| EPS, Q3 2026 | Per share |
|---|---|
| Reported (GAAP) | $7.22 |
| Non-GAAP | $7.48 |
| IPR&D charge per share (reported) | $4.57 |
| GAAP before IPR&D (d) | $11.79 |
| Non-GAAP before IPR&D (d) | $12.05 |
| Implied share count (d) | about 915M |
| Other benefits per share, pre-tax (d) | about $0.98 |
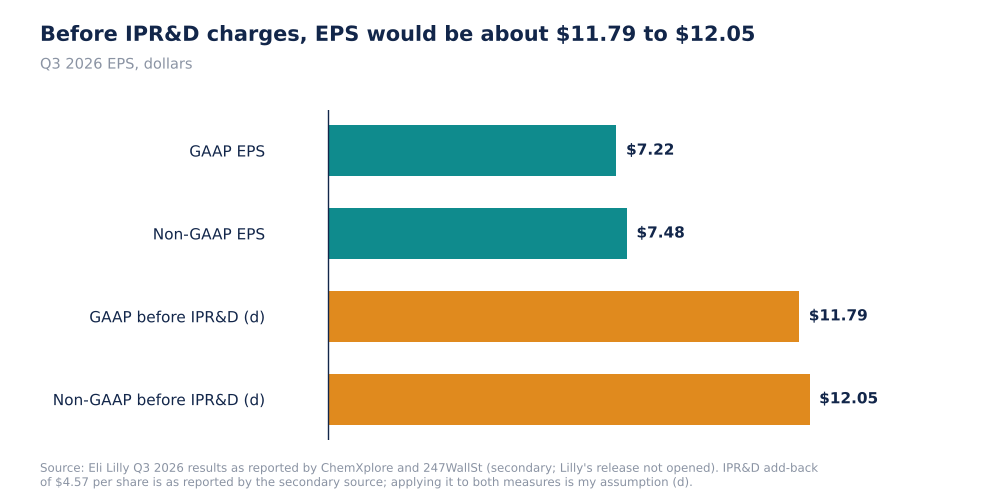
Lilly Q3 2026 EPS With And Without IPR&D (Self-Made, d)
Acquired IPR&D is a cost of buying research assets that are not yet approved. Lilly's non-GAAP EPS of $7.48 is only $0.26 above GAAP, so the non-GAAP measure appears to include the IPR&D charge and exclude only smaller items (that is my reading of the numbers, not a statement I can check against the release). Adding the $4.57 back gives about $11.79 and $12.05 (d), but those figures assume the per-share amount applies to both measures and ignore any tax effect. The implied share count of about 915 million (d: $4.18B / $4.57) is only a cross-check. The roughly $900 million of other benefits, about $0.98 per share before tax (d), partly offsets the charge.
Why it matters. Large IPR&D charges are a recurring part of a pharmaceutical company's investment in its pipeline. They do not distort the cash cost of the deals, but they do make quarter-to-quarter EPS volatile. A stable view needs several quarters.
Sources (secondary): ChemXplore; 247WallSt. Derived figures marked (d).
Forensic #4: Guidance
| 2026 revenue guidance | Low | High | Midpoint (d) |
|---|---|---|---|
| Previous | $85B | $87B | $86.0B |
| New | $91B | $92B | $91.5B |
| Change (d) | +$6B | +$5B | +$5.5B |
The range narrowed and rose: the low end moved up by $6 billion and the high end by $5 billion (d). The raise is about 6.4% of the old midpoint (d). I have no year-to-date revenue in my sources, so I cannot work out the revenue implied for the fourth quarter. I also have no EPS guidance.
Why it matters. A raise of about 6% (d) at the midpoint says management sees more revenue than it did, and the next question is whether volume growth stays ahead of the price decline.
Sources (secondary): ChemXplore; 247WallSt.
Valuation Snapshot
I have no Lilly share price in my sources, so I do not calculate multiples. The earnings base is quarterly EPS of $7.22 (GAAP) or $7.48 (non-GAAP), with about $4.57 per share of IPR&D in the quarter.
What has to be true. For revenue to meet the raised $91 billion to $92 billion, volume growth must stay far above the price decline. Any further price resets, such as the China change, subtract directly from that.
Risks: What Would Break The Thesis
- Secondary sources. Lilly's release was not opened.
- Additive growth. Contributions are percentage points and rounding can hide detail.
- IPR&D treatment. My add-back assumes the same $4.57 applies to both EPS measures.
- Pricing. Price already subtracts 15 points and the extract names China as one driver.
- Missing data. No product splits, no EPS guidance, no price.
The reading would be wrong if Lilly's release shows a different IPR&D treatment or if the price effect is concentrated in a one-off.
What To Watch Next
- Lilly's own Q3 release and 10-Q, to check each figure here.
- The next quarter's volume and price contributions.
- IPR&D charges and business-development spending.
- Fourth-quarter revenue against the $91B to $92B range.
- International growth after the China reimbursement-list price effect.
- Any change to EPS guidance.

Sandeep Gupta
Independent equity research analyst publishing forensic theses on US-listed stocks. MBA, Politecnico di Milano School of Management (Milan, Italy).
Get new research in your inbox
Subscribe to receive forensic equity research the moment it's published. Free, no spam.

Discussion
Be the first to comment.