
Investment Thesis
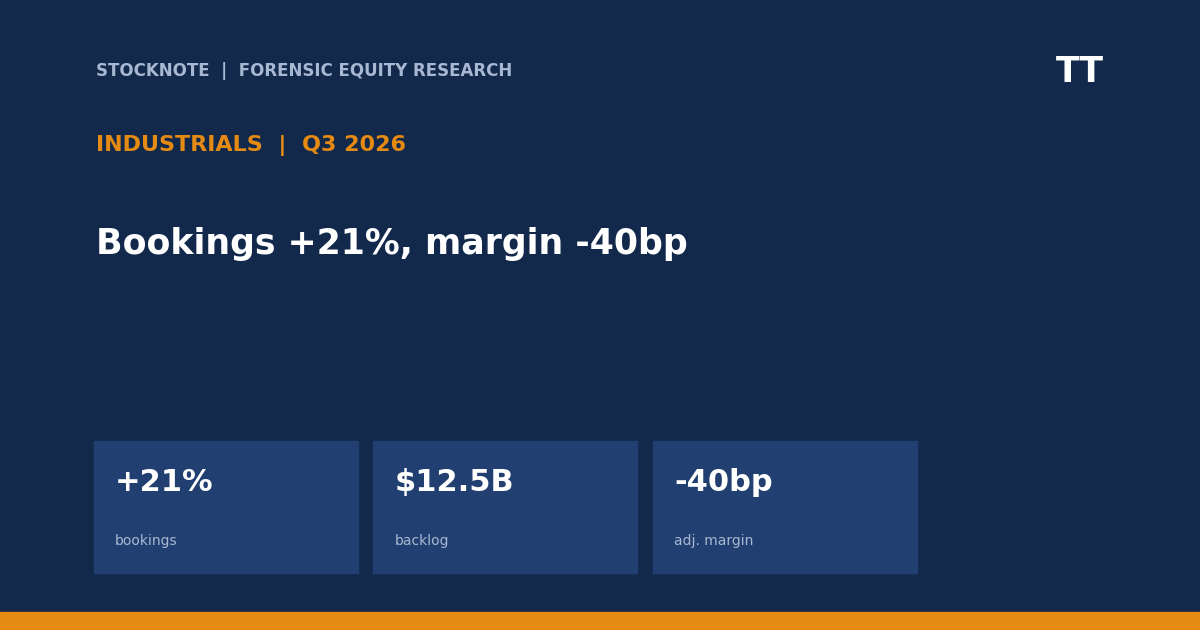
Trane Technologies reported Q3 2026 bookings of $7,248M, revenue of $6,760M and backlog of $12.5B. Demand is strong: organic bookings rose 20% and book-to-bill was 107%. Yet adjusted operating margin fell 40 basis points to 20.2%. The decomposition matters—Americas margin expanded 50 bp while EMEA and Asia Pacific contracted 250 bp and 390 bp, respectively.
- Demand. Bookings +21%; organic +20%; backlog +73%.
- Revenue. $6,760M, +18%; organic +16%.
- Margin. Adjusted operating income +15%, margin -40 bp.
- Cash. Nine-month free cash flow $2,828M, +58% (d).
- Capital. About $930M dividends, $1.08B M&A and $1.4B repurchases through October.
- This article contains no rating, price target or investment advice. Derived figures are marked (d).
Bottom line. Trane has demand visibility, but margin is not following revenue at the consolidated level. The Americas engine is masking international contraction, so the backlog should be valued by region and margin, not only by size.
Source: Trane Technologies Q3 2026 earnings release (8-K Ex. 99.1).
Q3 2026 At A Glance
| Measure | Q3 2026 | Q3 2025 |
|---|---|---|
| Bookings | $7,248M | $5,979M |
| Revenue | $6,760M | $5,743M |
| Adjusted operating income | $1,364M | $1,182M |
| Adjusted margin | 20.2% | 20.6% |
| Adjusted EPS | $4.86 | $3.88 |
| Backlog | $12.5B | +73% y/y |
Source: Trane Technologies Q3 2026 earnings release (8-K Ex. 99.1). Derived figures are marked (d).
What The Market Believes vs. What The Data Actually Shows
| Belief | What the data show |
|---|---|
| A record backlog guarantees margin expansion | Adjusted margin fell 40 bp despite 18% revenue growth. |
| The margin issue is company-wide | Americas margin expanded 50 bp; EMEA and Asia caused the decline. |
| Bookings and revenue are equally strong everywhere | EMEA bookings rose 40% on only 1% reported revenue growth. |
| Cash growth came from profit alone | Working capital/revenue improved from 3.9% to 0.3%, releasing cash. |
Forensic #1: Bookings, Revenue And Backlog
Book-to-bill above one means orders exceed recognized revenue, which usually expands backlog. It does not specify the margin or timing of that backlog.
| Measure | Q3 2025 | Q3 2026 | Change |
|---|---|---|---|
| Bookings | $5,979M | $7,248M | +21% |
| Revenue | $5,743M | $6,760M | +18% |
| Book-to-bill | 1.04x (d) | 1.07x | |
| Backlog | $12.5B | +73% |
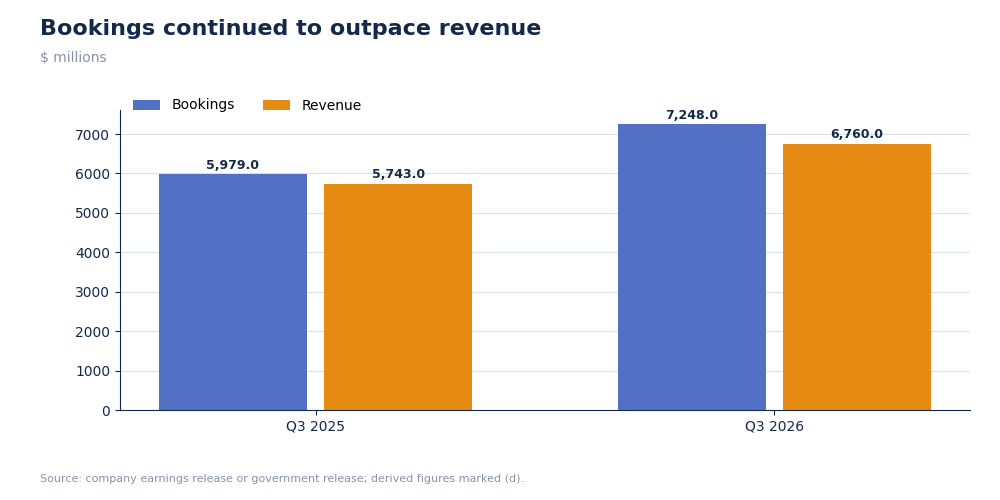
Trane bookings and revenue, Q3
Bookings exceeded revenue by $488M (d), adding to backlog. The prior-year excess was $236M (d), so the quarterly backlog inflow roughly doubled (d).
Why it matters. Demand visibility improved, but it must translate into profitable shipments.
Source: Trane Technologies Q3 2026 earnings release (8-K Ex. 99.1)
Forensic #2: Regional Margin Decomposition
Consolidated margin is a weighted average. A large profitable region can hide deterioration in smaller regions.
| Region | Revenue growth | Adjusted margin 2025 | Adjusted margin 2026 |
|---|---|---|---|
| Americas | +21% | 21.8% | 22.3% |
| EMEA | +1% | 19.7% | 17.2% |
| Asia Pacific | +8% | 22.5% | 18.6% |
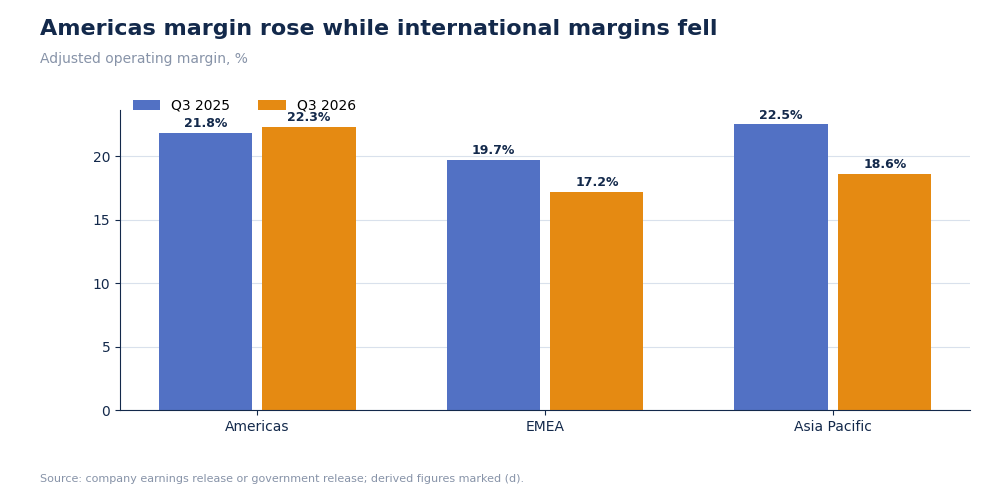
Trane adjusted operating margin by region
Americas produced nearly all of the profit growth. EMEA and Asia had positive revenue but lower operating income, showing negative incremental margins.
Why it matters. Backlog outside the Americas may be less valuable until pricing and cost normalize.
Source: Trane Technologies Q3 2026 earnings release (8-K Ex. 99.1)
Forensic #3: Operating Leverage
Incremental margin compares added operating income with added revenue. A rate below the starting margin means growth diluted profitability.
| Measure | Q3 2025 | Q3 2026 | Change |
|---|---|---|---|
| Revenue | $5,743M | $6,760M | +$1,017M |
| Adjusted operating income | $1,182M | $1,364M | +$182M |
| Adjusted margin | 20.6% | 20.2% | -40 bp |
| Incremental margin (d) | 17.9% |
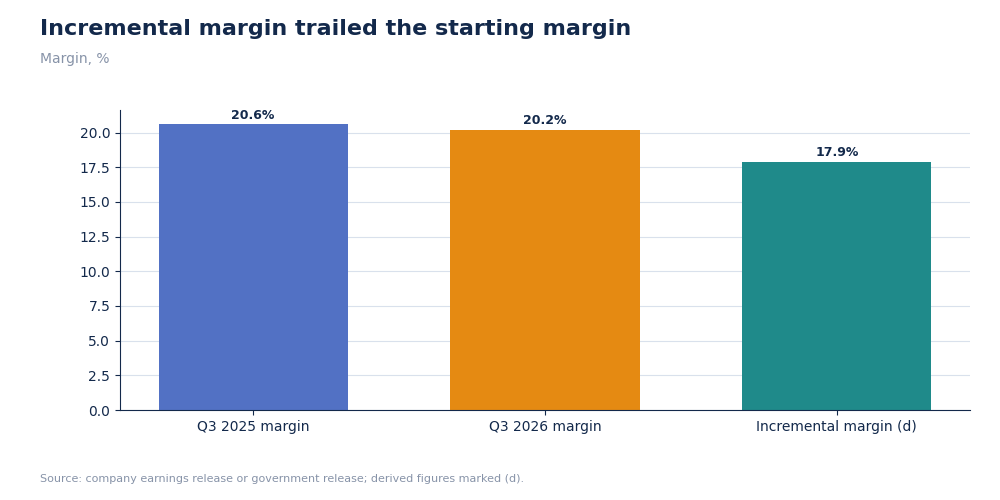
Trane adjusted operating margin and incremental margin
Incremental margin of 17.9% (d) was below the 20.6% starting margin, so each new revenue dollar earned less than the existing base.
Why it matters. Strong revenue growth can still dilute value when the marginal rate is lower.
Source: Trane Technologies Q3 2026 earnings release (8-K Ex. 99.1)
Forensic #4: Free Cash Flow And Working Capital
Cash conversion can rise because of profit or because inventories and receivables release cash. Working capital as a share of revenue isolates the second effect.
| Nine months | 2025 | 2026 |
|---|---|---|
| Operating cash flow | $2,054M | $3,060M |
| Free cash flow | $1,786M | $2,828M |
| Working capital / revenue | 3.9% | 0.3% |
| Debt | $4,616M | $4,218M |
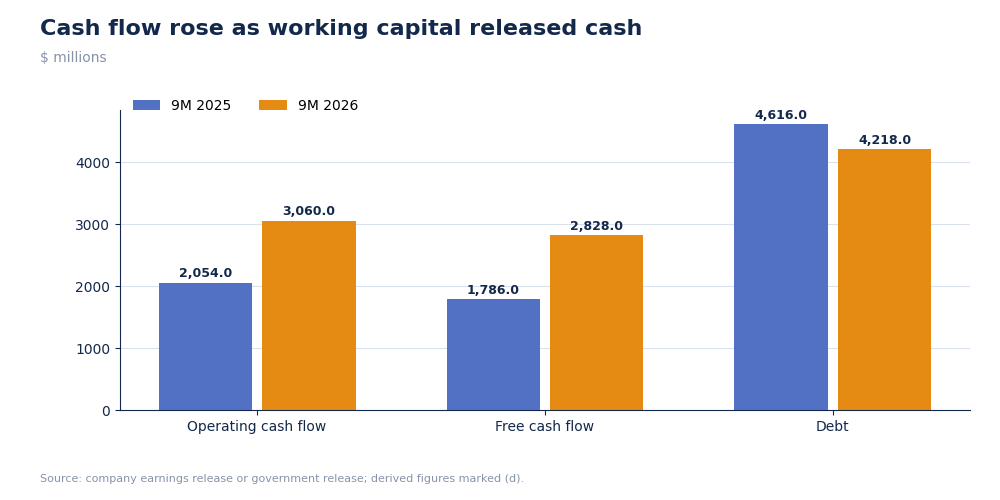
Trane nine-month cash flow and debt
Free cash flow rose $1,042M, while working capital/revenue improved 360 bp. The cash gain is therefore stronger than profit growth alone, but some benefit is a balance-sheet release that cannot repeat indefinitely.
Why it matters. Cash conversion should be normalized before comparing it with repurchases and dividends.
Source: Trane Technologies Q3 2026 earnings release (8-K Ex. 99.1)
Valuation Snapshot
At $413.33 per share, Trane had a market capitalization of $91.51B and a reported trailing P/E of 29.19x. Adding $4.218B of debt and subtracting $1.227B of cash gives enterprise value of approximately $94.50B (d).
| Measure | Value |
|---|---|
| Share price | $413.33 |
| Market capitalization | $91.51B |
| Enterprise value | $94.50B (d) |
| Reported trailing P/E | 29.19x |
| P/E on annualized Q3 adjusted EPS | 21.3x (d) |
| Price / annualized nine-month FCF | 24.3x (d) |
| Annualized FCF yield | 4.1% (d) |
| EV / annualized Q3 revenue | 3.49x (d) |
Investment read-through. Trane's premium valuation requires backlog conversion and margin repair outside the Americas. A one-point reduction in the 20.2% adjusted margin on annualized Q3 sales would reduce operating income by about $270M (d), illustrating why the EMEA and Asia margin declines matter despite strong bookings.
What has to be true. International backlog must convert near normalized margins and current working-capital benefits must not reverse enough to push the FCF yield below 4%.
Source: Market quote, market capitalization and trailing P/E from the in-session U.S. equity market feed; cash-flow and balance-sheet figures from Trane's Q3 2026 release. Market data: latest quote retrieved after the November 2, 2026 U.S. trading session.
Risks: What Would Break The Thesis
- International margin. EMEA and Asia contracted materially.
- Supply chain and inflation. Management cited both as headwinds.
- Working capital. Current cash conversion includes a large release.
- Capital return. Repurchases consume cash before backlog conversion is complete.
The reading would be too cautious if EMEA bookings convert at normalized margins and Americas continues its positive rate trend.
What To Watch Next
- Consolidated adjusted margin against 20.2%.
- EMEA adjusted margin against 17.2%.
- Asia Pacific adjusted margin against 18.6%.
- Backlog against $12.5B.
- Working capital/revenue after the drop to 0.3%.

Sandeep Gupta
Independent equity research analyst publishing forensic theses on US-listed stocks. MBA, Politecnico di Milano School of Management (Milan, Italy).
Get new research in your inbox
Subscribe to receive forensic equity research the moment it's published. Free, no spam.
Discussion
Be the first to comment.