
Investment Thesis
The Congressional Budget Office's Monthly Budget Review shows a federal deficit of $1,993 billion for fiscal 2026 (October 2025 to September 2026), up from $1,775 billion in fiscal 2025. Receipts rose $168 billion (3%, d) to $5,403 billion, while outlays rose $386 billion (6%, d) to $7,396 billion. Net interest rose 11% to $1,143 billion. For investors the figures matter because the government is now paying about 21 cents of every dollar it receives in interest (d), and because the Treasury's borrowing needs feed straight into the yields discussed in Stocknote's term-premium article (10-year 5.024%, 30-year 5.351% on October 28).
- Deficit. $1,993B in fiscal 2026 against $1,775B: up $218B (d), or 12% (d).
- Receipts. $5,403B against $5,235B: individual income taxes $2,844B (+7%), payroll taxes $1,815B, corporate income taxes $382B (-16%), customs duties $172B (-11%).
- Outlays. $7,396B against $7,010B (+5.5%, d): Social Security $1,654B, Medicare $1,069B, Medicaid $723B, defense $916B, veterans $416B, net interest $1,143B (+11%).
- Tariff refunds. The CBO says customs receipts include about $130B of refunds of tariffs imposed under the International Emergency Economic Powers Act, following a Supreme Court decision in February 2026.
- This article contains no rating, price target or investment advice. Derived figures are marked (d).
Bottom line. Interest is the one large budget line that is growing faster than the economy and cannot be legislated away in the short term, because it reflects the stock of debt and the level of rates. At 21.2% of receipts (d) in fiscal 2026 against 19.6% (d) in fiscal 2025, it takes a larger share of revenue even as the headline deficit widens.
Source: CBO Monthly Budget Review, FY2026.
Fiscal 2026 At A Glance
| $ billions | FY2026 | FY2025 | Change |
|---|---|---|---|
| Total receipts | 5,403 | 5,235 | +168 (d) |
| Total outlays | 7,396 | 7,010 | +386 (d) |
| Deficit | 1,993 | 1,775 | +218 (d) |
| Individual income taxes | 2,844 | n/a | +7% |
| Payroll taxes | 1,815 | n/a | n/a |
| Corporate income taxes | 382 | n/a | -16% |
| Customs duties | 172 | n/a | -11% |
| Net interest | 1,143 | 1,028 | +11% |
Source: CBO. Prior-year dollar amounts for several lines are not in my extract (n/a). Changes marked (d) are my subtraction.
What The Market Believes vs. What The Data Actually Shows
| Belief | What the data show |
|---|---|
| Tariffs are a growing source of revenue | Customs duties were $172B, down 11%, after about $130B of refunds of IEEPA tariffs. Gross collection was therefore higher than the net figure shows. |
| Corporate tax cuts show up in receipts | Corporate income taxes fell 16% to $382B. The extract does not state the cause. |
| The deficit is driven by interest | Net interest rose $115B (d), explaining 30% (d) of the $386B rise in outlays; most of the rise came from other lines. |
| Entitlements are the largest line | Social Security ($1,654B) is larger than net interest ($1,143B), and Medicare ($1,069B) is now only $74B (d) below it. |
| The deficit is shrinking | It rose from $1,775B to $1,993B, or from 34% (d) to 37% (d) of receipts. |
Forensic #1: The Receipts Side
| Receipts line | FY2026 ($B) | Change | Share of total (d) |
|---|---|---|---|
| Individual income taxes | 2,844 | +7% | 53% |
| Payroll taxes | 1,815 | n/a | 34% |
| Corporate income taxes | 382 | -16% | 7% |
| Customs duties | 172 | -11% | 3% |
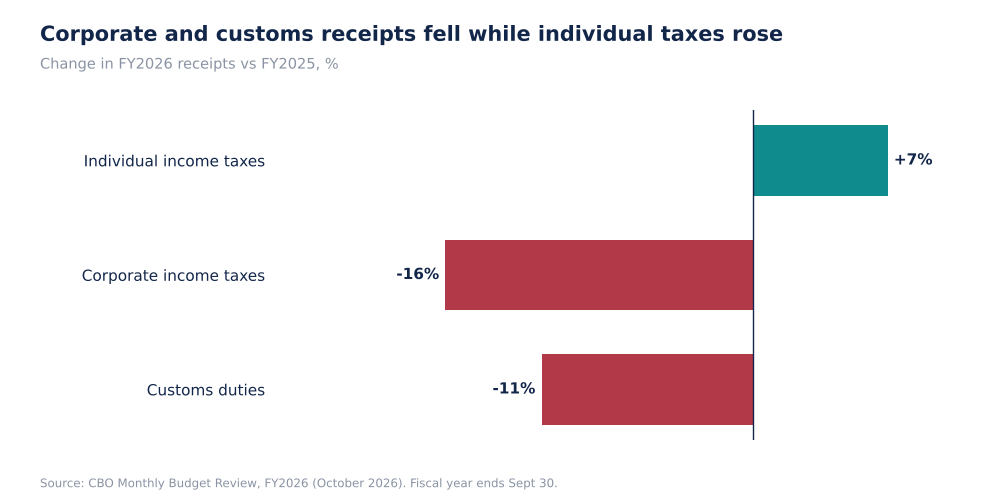
Change In Selected Federal Receipts, FY2026 Vs FY2025 (Self-Made, CBO Data)
Individual income taxes supplied 53% of receipts (d) and grew 7%, a rise consistent with the income and wage growth in the jobs data, although the extract does not give the cause. Corporate taxes were only 7% of receipts (d) and fell 16%. Customs duties were 3% of receipts (d). Because the CBO states that refunds of about $130 billion are netted in the customs figure, the $172 billion is the net revenue after returning tariffs that were struck down, not a measure of tariff rates.
Why it matters. Receipts grew 3.2% (d) while outlays grew 5.5% (d). Whenever spending grows faster than revenue from a deficit starting point, the gap widens mechanically, and that is what happened in fiscal 2026.
Source: CBO. Shares are my arithmetic (d).
Forensic #2: The Outlays Side
| Outlay line | FY2026 ($B) | Share of outlays (d) |
|---|---|---|
| Social Security | 1,654 | 22% |
| Net interest | 1,143 | 15% |
| Medicare | 1,069 | 14% |
| Defense | 916 | 12% |
| Medicaid | 723 | 10% |
| Veterans | 416 | 6% |
| Education (timing effect) | 75 | n/a |
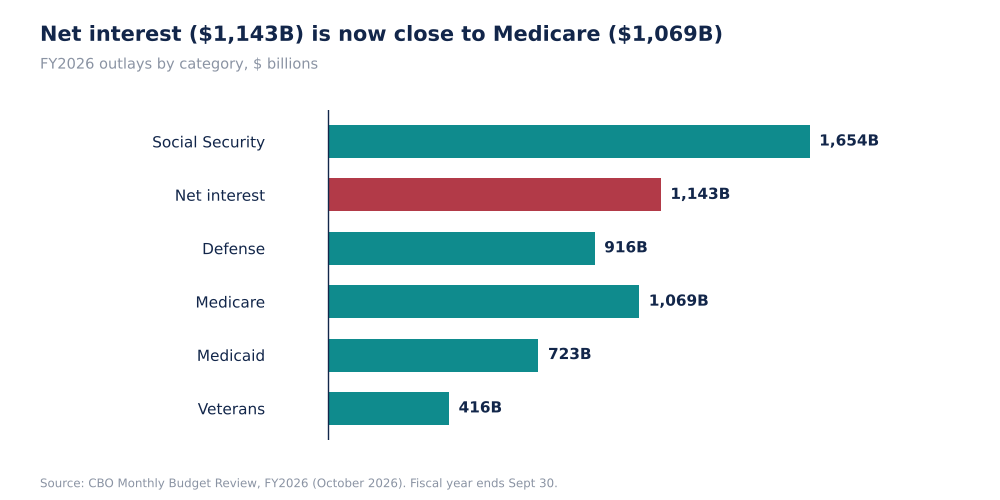
Selected Federal Outlays, FY2026, $B (Self-Made, CBO Data)
Net interest at 15% of outlays (d) is larger than defense (12%, d) and Medicaid (10%, d). Medicare is within $74 billion (d). The CBO notes that education outlays of $75 billion reflect a timing effect, so that line should not be read as a trend.
Why it matters. Defense and Medicaid can be changed by appropriations and eligibility rules. Interest can be changed only by the level of rates or the stock of debt, and the Treasury curve in Stocknote's term-premium article (2-year 4.706%, 10-year 5.024%) shows rates are not falling.
Source: CBO. Shares are my arithmetic (d).
Forensic #3: Interest As A Share Of Revenue
| Measure | FY2025 | FY2026 |
|---|---|---|
| Net interest ($B) | 1,028 | 1,143 |
| Receipts ($B) | 5,235 | 5,403 |
| Interest / receipts (d) | 19.6% | 21.2% |
| Deficit / receipts (d) | 33.9% | 36.9% |
| Growth in interest | n/a | +11% |
| Growth in receipts (d) | n/a | +3.2% |
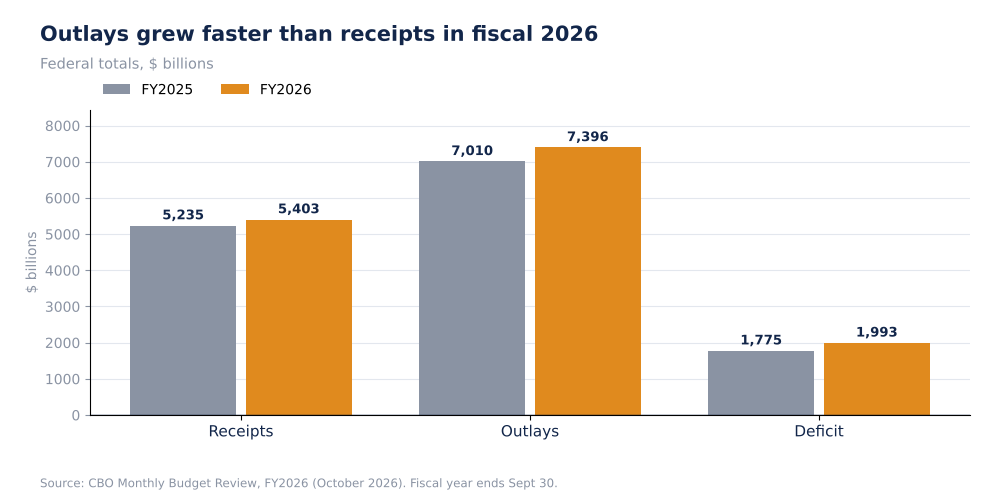
Federal Receipts, Outlays And Deficit, FY2025 Vs FY2026, $B (Self-Made, CBO Data)
Interest grew 11% while receipts grew 3.2% (d), so the interest burden on revenue rose by about 1.5 percentage points (d). If net interest kept growing at 11% while receipts grew at 3%, the ratio would keep rising; that is arithmetic, not a forecast.
Why it matters. A rising interest ratio is the mechanism by which a deficit can become self-reinforcing: higher interest raises the deficit, which raises borrowing, which raises interest. The CBO review does not project beyond the year, so this article offers no forecast of its own.
Source: CBO. Ratios and growth rates are my arithmetic (d).
Forensic #4: What The Deficit Means For Markets
| Market variable (Oct 28-29, 2026) | Level |
|---|---|
| 2-year Treasury | 4.706% |
| 10-year Treasury | 5.024% |
| 30-year Treasury | 5.351% |
| Fed funds range | 3.75% to 4.00% |
| Freddie Mac 30-year mortgage (Oct 29) | 7.24% |
| Term spread, 10-year less 2-year (d) | +0.32 points |
The 10-year yield is 1.15 points above the midpoint of the Fed funds range (d: 5.024 - 3.875), a gap that Stocknote's term-premium article attributes partly to inflation expectations and partly to the compensation investors require for holding long bonds. The deficit data are one input to that compensation, because larger deficits mean larger issuance. Whether they are the dominant driver cannot be established from these sources.
Why it matters. Mortgage rates (7.24%), corporate borrowing costs and the equity risk premium all price off the Treasury curve. A fiscal path that needs $1,993 billion of net borrowing a year is a reason the long end can stay high even if the Fed cuts.
Sources: Federal Reserve (policy range); market levels as cited in Stocknote's term-premium article. Spreads are my arithmetic (d).
Valuation Snapshot
This is a macro article, so no single valuation applies. The fiscal variables are:
| Measure | FY2026 |
|---|---|
| Deficit | $1,993B |
| Net interest | $1,143B |
| Interest / receipts (d) | 21.2% |
| Interest / outlays (d) | 15.5% |
| Tariff refunds netted in customs | about $130B |
What has to be true. For the interest ratio to stop rising, receipts have to grow at least as fast as interest, or rates have to fall. Receipts grew 3.2% (d) and interest 11% in the past year.
Risks: What Would Break The Thesis
- One-offs. The tariff refunds (about $130B) and the education timing effect distort single lines.
- Prior-year gaps. My extract lacks FY2025 dollar amounts for several receipts lines.
- Monthly review. The CBO's figures are estimates from Treasury data and are not final.
- Rates. A fall in yields would slow interest growth faster than the arithmetic here assumes.
The reading would be wrong if receipts accelerated, for example through a recovery in corporate taxes, or if refunds proved to be a one-time reduction.
What To Watch Next
- The CBO's next monthly review for October 2026, covering the first month of fiscal 2027.
- Customs receipts after the refunds.
- Net interest as a share of receipts against 21.2%.
- Treasury refunding announcements and auction sizes.
- The 10-year yield against 5.024%.
- Corporate tax receipts after the 16% fall.

Sandeep Gupta
Independent equity research analyst publishing forensic theses on US-listed stocks. MBA, Politecnico di Milano School of Management (Milan, Italy).
Get new research in your inbox
Subscribe to receive forensic equity research the moment it's published. Free, no spam.
Discussion
Be the first to comment.