
Investment Thesis
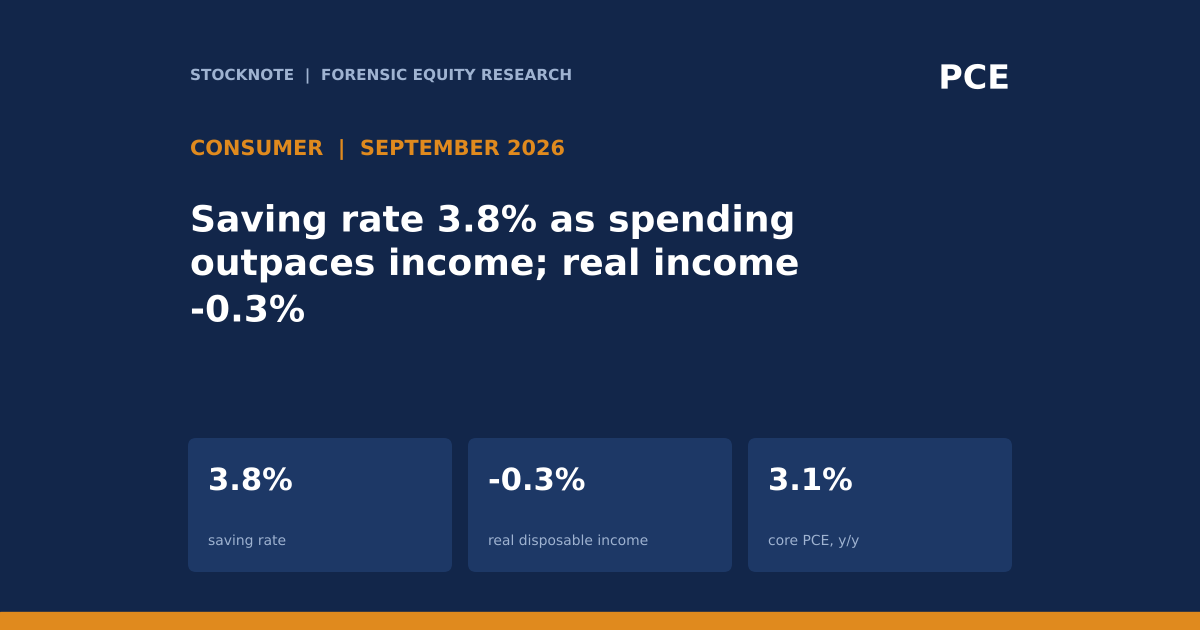
The Bureau of Economic Analysis reported on October 29 that US personal income rose 0.2% in September (+$54.5 billion) and disposable personal income rose 0.2% (+$52.7 billion), while spending rose 0.5% (+$113.1 billion). Prices did the work: the PCE price index rose 0.5% in the month and 3.6% over twelve months, so real spending was essentially flat and real disposable income fell 0.3%. The personal saving rate was 3.8% ($911.1 billion). This article fills the gap left in Stocknote's GDP and jobs analysis, which could not say how consumer spending grew 3.8% in the third quarter while real wages fell. It also explains why the Fed's preferred inflation gauge, core PCE at 3.1%, is running above core CPI at 2.6%.
- Income. Personal income +0.2%; disposable income +0.2% (+$52.7B); real disposable income -0.3% (August: 0.0%). The release attributes the income rise mainly to compensation, led by private wages and salaries, and to government social benefits, led by Medicare.
- Spending. Nominal PCE +0.5% (+$113.1B; August +0.9%): goods +$35.1B, services +$78.1B. Real PCE +$2.6B, shown as 0.0% (August +0.5%).
- Prices. PCE price index +0.5% m/m (August +0.3%) and +3.6% y/y; core PCE +0.3% m/m and +3.1% y/y.
- Saving. Personal saving $911.1B, a rate of 3.8%.
- This article contains no rating, price target or investment advice. Every figure comes from a named source and anything I calculated is marked (d).
Bottom line. Households spent $113.0 billion more in September while disposable income rose $52.7 billion, so personal saving fell about $60 billion (d) in a month. Spending in nominal terms is being held up by prices and by drawing down saving, not by income growth. A saving rate of 3.8% leaves less room to repeat that. Real spending was flat in September after +0.5% in August, which suggests that the 3.8% annualised growth in third-quarter consumption was concentrated in the first two months of the quarter.
Sources: BEA Personal Income and Outlays, September 2026; BEA GDP advance estimate, Q3 2026; BLS CPI, September 2026; BLS Employment Situation, September 2026.
September 2026 At A Glance
| Measure | September 2026 | Prior |
|---|---|---|
| Personal income | +0.2% (+$54.5B) | n/a |
| Disposable personal income (nominal) | +0.2% (+$52.7B) | n/a |
| Real disposable personal income | -0.3% | August 0.0% |
| Nominal PCE | +0.5% (+$113.1B) | August +0.9% |
| Real PCE | 0.0% (+$2.6B) | August +0.5% |
| PCE price index, m/m / y/y | +0.5% / +3.6% | August +0.3% m/m |
| Core PCE, m/m / y/y | +0.3% / +3.1% | August +0.3% m/m |
| Personal saving / saving rate | $911.1B / 3.8% | Prior month not stated |
Source: BEA, Oct 29, 2026. July and August were revised to reflect revised BLS payroll data.
What The Market Believes vs. What The Data Actually Shows
| Belief | What the data show |
|---|---|
| The consumer is strong | Nominal spending rose 0.5% but real spending was flat (0.0%); the volume of goods and services bought did not grow in September. |
| Incomes are supporting spending | Disposable income rose 0.2% in nominal terms, less than half the 0.5% rise in spending, and fell 0.3% in real terms. |
| Inflation is easing | The quarterly PCE price rise slowed (2.1% annualised in Q3), but the monthly rate rose to 0.5% in September from 0.3% in August, and the y/y rate is 3.6%. |
| Core inflation is lower than headline CPI suggests | Core CPI was 2.6% and core PCE 3.1%; on the Fed's own preferred gauge, core is 0.5 points higher than CPI's (d). |
| Households have large savings buffers | The saving rate was 3.8% ($911.1B), and saving fell by about $60B (d) in the month as spending outpaced income. |
The extract does not give an estimate of accumulated excess savings, so no claim about the size of household buffers is made here.
Forensic #1: Income, Spending And The Saving Rate
| Change, September 2026 | Amount ($B) | Source |
|---|---|---|
| Disposable personal income | +52.7 | BEA |
| Personal outlays | +113.0 | BEA |
| Personal saving (income less outlays) (d) | -60.3 | derived |
| Personal saving level | 911.1 | BEA |
| Saving a month earlier (d) | about 971 | 911.1 + 60.3 |
| Saving rate, now / implied before (d) | 3.8% / about 4.1% | derived |
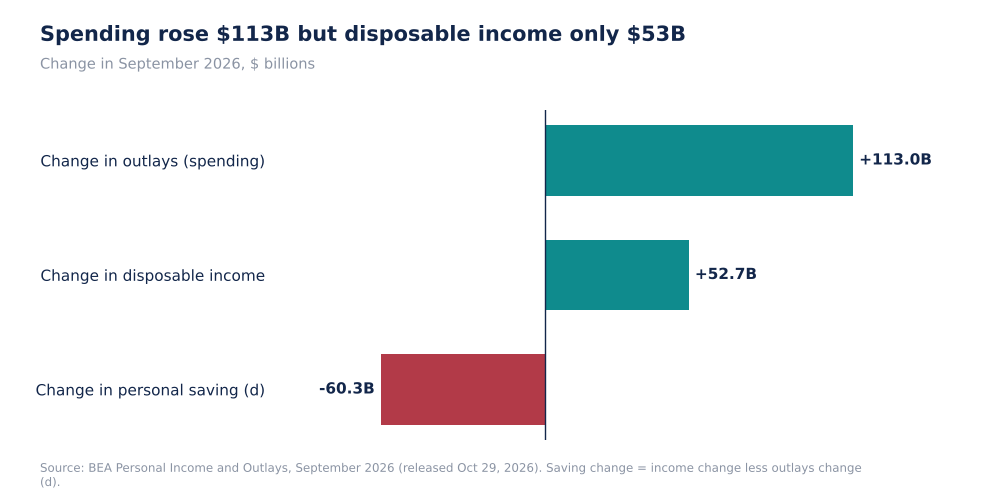
September 2026 Change In Spending, Income And Saving, $B (Self-Made, d)
In the national accounts, saving is disposable income minus outlays, so the two BEA changes imply that saving fell by about $60.3 billion (d). Dividing saving of $911.1 billion by the 3.8% rate gives disposable income of about $24.0 trillion at an annual rate (d), and a prior-month saving rate of about 4.1% (d: $971B on about $23.9 trillion). The prior-month rate was not stated in the extract and July and August were revised, so treat this as an estimate.
Why it matters. The consumer supplied a $113 billion increase in demand in a month by cutting saving by $60 billion, not by earning more. That can continue only while the saving rate has room to fall, and 3.8% is already low. In practical terms, either incomes accelerate or spending slows.
Source: BEA. Derived items marked (d).
Forensic #2: Real Versus Nominal
| Measure (m/m) | Nominal | Real | Difference (price effect) |
|---|---|---|---|
| Spending (PCE) | +0.5% | 0.0% | +0.5 pts (the PCE price index rose 0.5%) |
| Disposable income | +0.2% | -0.3% | +0.5 pts |
| August spending | +0.9% | +0.5% | +0.4 pts |
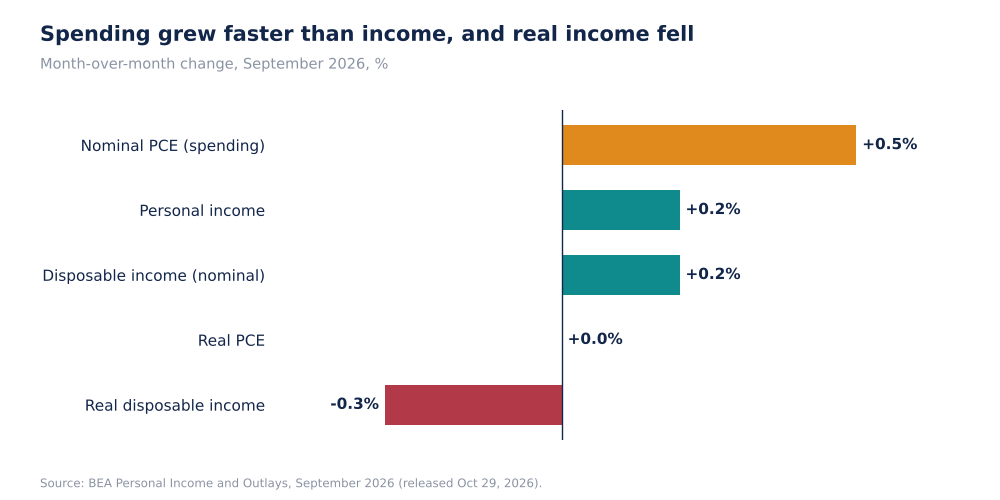
September 2026 Month-Over-Month Changes, % (Self-Made, BEA Data)
The price effect in September was 0.5 points in both spending and income, because the same price index deflates both. That leaves real spending at zero and real income at -0.3% (d: 0.2 - 0.5). In August, nominal spending rose 0.9% and real spending 0.5%, which is why the third quarter's consumption growth (3.8% annualised in the GDP release) was concentrated in July and August. The extract gives only August's real figure and not July's, so I cannot show July.
Why it matters. A single month of flat real spending is not a trend, but it arrives with falling real income and a lower saving rate. Together those are the combination that precedes a slowdown in consumption, and they are the data that the Fed will read alongside the 3.7% September CPI.
Sources: BEA; BEA GDP release. Differences are my arithmetic (d).
Forensic #3: Why Core PCE Is Above Core CPI
| 12-month inflation, September 2026 | CPI | PCE price index | PCE less CPI (d) |
|---|---|---|---|
| Headline | 3.7% | 3.6% | -0.1 |
| Core (ex food and energy) | 2.6% | 3.1% | +0.5 |
| Energy (CPI) | +20.4% | n/a | n/a |
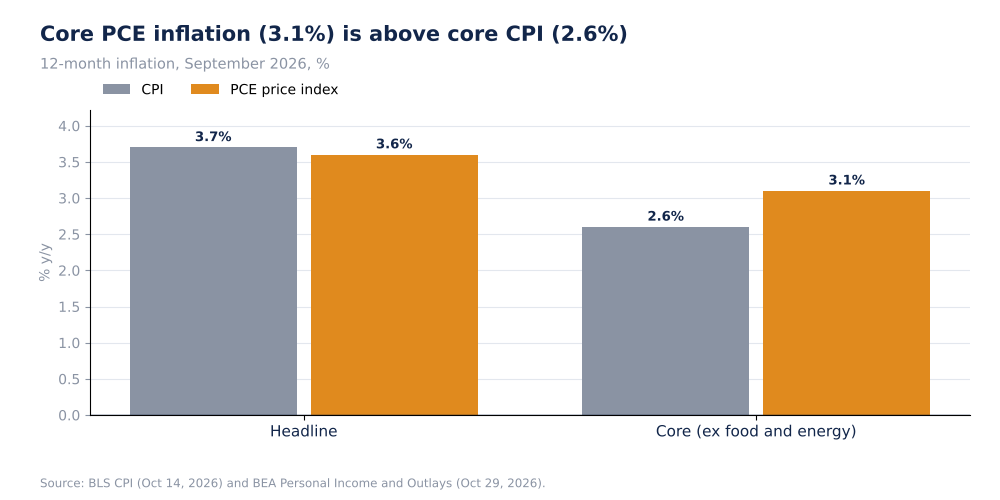
CPI Vs PCE Inflation, 12-Month %, September 2026 (Self-Made)
The two indexes measure different things. CPI is built from what urban households buy; the PCE index covers all personal consumption, including spending made on households' behalf (for example by employers and Medicare), and uses different weights and a different formula. Headline PCE is slightly below CPI (3.6% against 3.7%), which matches the usual direction because CPI carries a larger weight on energy and shelter. Core runs the other way: PCE (3.1%) is above CPI (2.6%) by 0.5 points (d). The extracts I read do not explain the reversal. One possibility is that components with a larger weight in PCE than in CPI, such as health care and financial services, are rising faster, but I have no component data to test that, so it is a hypothesis.
Why it matters. The Fed's inflation target refers to PCE, so the relevant core figure for the December decision is 3.1% and not 2.6%. The December hike probability of 82.6% to about 85% (see Stocknote's Fed and term-premium articles) is consistent with a core PCE gauge that is more than a point above target.
Sources: BEA; BLS CPI. The difference is my arithmetic (d); the explanation is a hypothesis.
Forensic #4: Goods, Services And Who Is Paying
| Component of the $113.1B increase in nominal spending | Amount ($B) | Share (d) |
|---|---|---|
| Services | +78.1 | 69% |
| Goods | +35.1 | 31% |
| Total | +113.1 | 100% |
| Real wage backdrop: hourly earnings less CPI (12 months) | -0.7 points (d) | n/a |
| Unemployment rate (September) | 4.2% | BLS |
Services accounted for 69% of the increase in nominal spending (d), which fits the Q3 GDP detail (consumer services led by health care). Inflation is also higher for services than for goods in the CPI data discussed in Stocknote's Fed article (services excluding energy 3.1%, new vehicles 0.6%, used vehicles -1.5%), so part of the nominal increase in services is price. With average hourly earnings up 3.0% over twelve months against 3.6% for the PCE price index, workers are 0.6 points behind on the Fed's gauge (d), and 0.7 points on CPI (d).
Why it matters. Spending is increasingly in services, where prices are rising fastest, funded by a lower saving rate. A consumer who is paying more for the same quantity and has less income in real terms is a risk for companies selling discretionary goods, and a support for those with pricing power in necessities and health care.
Sources: BEA; BLS Employment Situation; BLS CPI. Shares and gaps are my arithmetic (d).
Valuation Snapshot
This is a macro article, so no single valuation applies. The consumer variables to track are:
| Measure | Latest |
|---|---|
| Personal saving rate | 3.8% |
| Real disposable income, m/m | -0.3% |
| Real PCE, m/m | 0.0% |
| PCE / core PCE, 12 months | 3.6% / 3.1% |
| Fed funds range | 3.75% to 4.00% |
| Next release (October data) | November 25, 2026 |
What has to be true. For consumer spending to keep growing in real terms, incomes have to accelerate (average hourly earnings are up 3.0% against inflation of 3.6% to 3.7%), or the saving rate has to fall further from 3.8%, or inflation has to ease. If none of these happens, real spending growth should converge to real income growth, which was negative in September.
Risks: What Would Break The Thesis
- Revisions. July and August were revised, and September will be.
- One month. A flat month of real spending is not a trend.
- Saving rate. The prior-month rate is not in my extract; the 4.1% is derived.
- Wealth effects. The S&P 500 closed at 7,743 on October 28; spending by higher-income households could be supported by asset values, which this release does not show.
- CPI versus PCE. The core gap is unexplained in my sources.
- Data limits. The extract has no interest-payment figure and no component price data.
The reading would be wrong if October brings a rebound in real income, for example from lower gasoline prices, or if the saving rate is revised higher.
What To Watch Next
- October personal income and outlays, due November 25, and the saving rate against 3.8%.
- Real disposable income after -0.3%.
- The October CPI, due November 10, and the core CPI-PCE gap.
- Retail and services spending against the flat real PCE in September.
- Average hourly earnings against 3.0%.
- The December FOMC decision.

Sandeep Gupta
Independent equity research analyst publishing forensic theses on US-listed stocks. MBA, Politecnico di Milano School of Management (Milan, Italy).
Get new research in your inbox
Subscribe to receive forensic equity research the moment it's published. Free, no spam.

Discussion
Be the first to comment.