
Investment Thesis
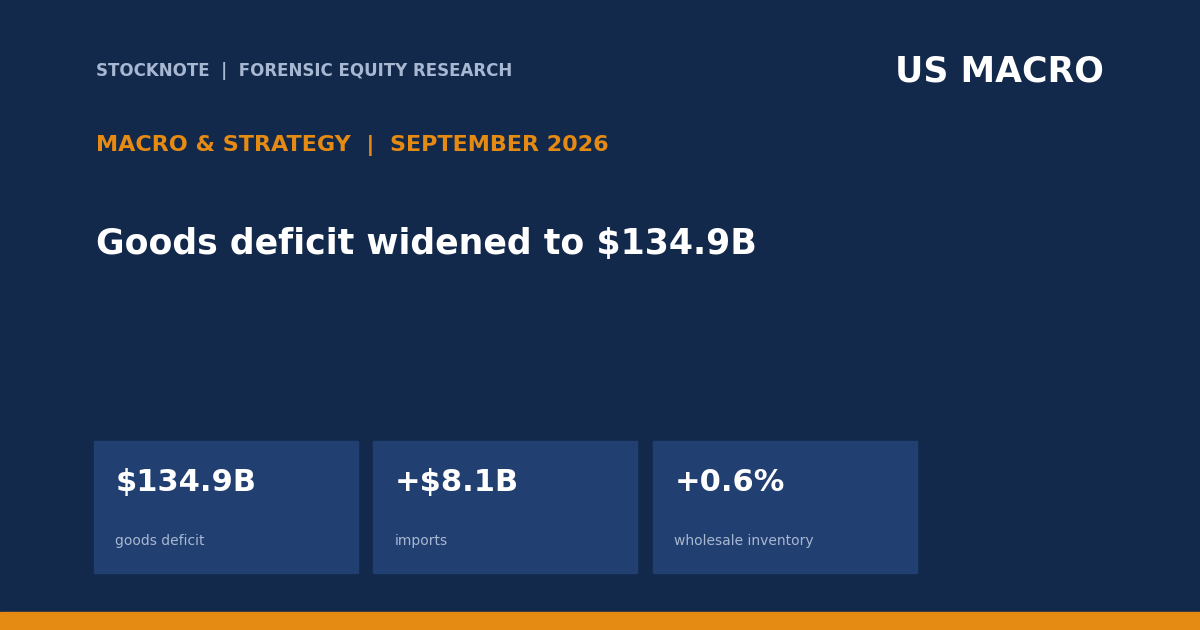
The September 2026 advance goods deficit widened $2.8B to $134.9B. Exports rose $5.3B to $209.2B, but imports rose $8.1B to $344.1B. At the same time, wholesale inventories increased 0.6% to $1,011.5B and retail inventories 0.3% to $885.3B. The release is nominal and inventories are not price-adjusted, so the clean conclusion is compositional: trade subtracted at the margin while inventory accumulation was faster upstream than at retailers.
- Deficit. $134.9B, up $2.8B from August.
- Exports. $209.2B, up $5.3B.
- Imports. $344.1B, up $8.1B.
- Wholesale inventories. $1,011.5B, +0.6% m/m and +7.4% y/y.
- Retail inventories. $885.3B, +0.3% m/m and +4.8% y/y.
- Cross-reference. Read with “US Q3 2026 GDP +3.4%” and “September 2026 Retail Sales: +0.8%, But Ex-Gas Only +0.2%.”
- This article contains no rating, price target or investment advice. Derived figures are marked (d).
Bottom line. The deficit widened because import growth exceeded export growth by $2.8B, exactly matching the deficit change (d). Inventory growth was faster at wholesalers than retailers, which could signal pipeline rebuilding or slower sell-through; the release alone cannot distinguish them.
Source: U.S. Census Bureau Advance Economic Indicators, September 2026.
September 2026 At A Glance
| Measure | September 2026 | August 2026 |
|---|---|---|
| Goods exports | $209.2B | $203.9B (d) |
| Goods imports | $344.1B | $336.0B (d) |
| Goods deficit | $134.9B | $132.1B |
| Wholesale inventories | $1,011.5B | $1,005.6B |
| Retail inventories | $885.3B | $882.7B (d) |
Source: U.S. Census Bureau Advance Economic Indicators, September 2026. Derived figures are marked (d).
What The Market Believes vs. What The Data Actually Shows
| Belief | What the data show |
|---|---|
| Exports rising means trade added to growth | Imports rose $2.8B more than exports, widening the deficit by the same amount. |
| Inventory growth means real volume increased | The estimates are not adjusted for price changes. |
| Retailers are building stock fastest | Wholesale inventories rose 0.6%, twice the retail rate of 0.3%. |
| The release revises nothing material | August retail inventory growth was revised from 0.2% to 0.3%. |
Forensic #1: Why The Deficit Widened
The trade balance is exports minus imports. When imports rise faster than exports, the deficit widens dollar for dollar.
| Goods trade | $B | Change from August |
|---|---|---|
| Exports | 209.2 | +5.3 |
| Imports | 344.1 | +8.1 |
| Deficit | 134.9 | +2.8 |
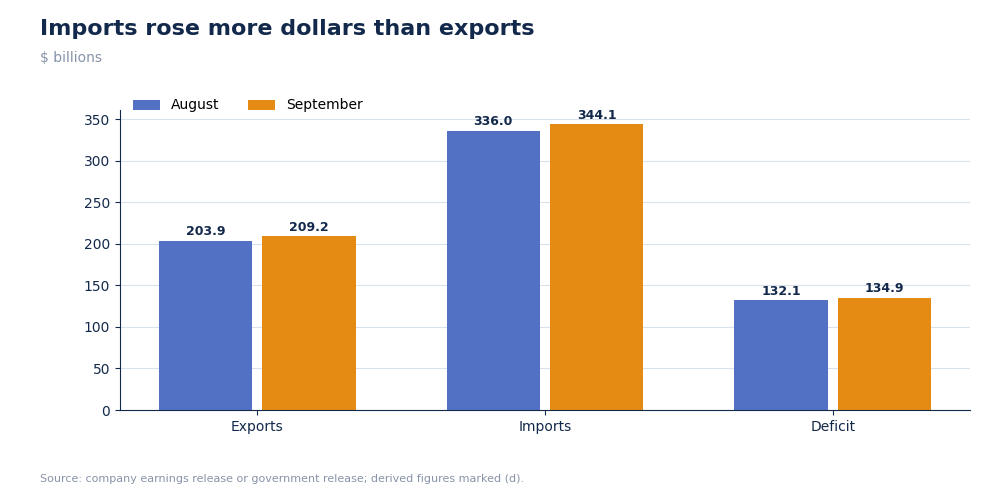
September 2026 U.S. goods exports, imports and deficit
The $8.1B import increase exceeded the $5.3B export increase by $2.8B (d), exactly the reported widening. Exports were not weak; imports simply grew faster.
Why it matters. The growth signal is composition, not direction: rising two-way trade can coexist with a larger drag from net exports.
Source: U.S. Census Bureau Advance Economic Indicators, September 2026
Forensic #2: Import Intensity
The import/export ratio measures how many dollars of goods are imported for each export dollar. It is not a competitiveness score, but it shows the scale of the imbalance.
| Measure | August | September |
|---|---|---|
| Exports | $203.9B (d) | $209.2B |
| Imports | $336.0B (d) | $344.1B |
| Import/export ratio | 1.65x (d) | 1.64x (d) |
| Deficit/export ratio | 64.8% (d) | 64.5% (d) |
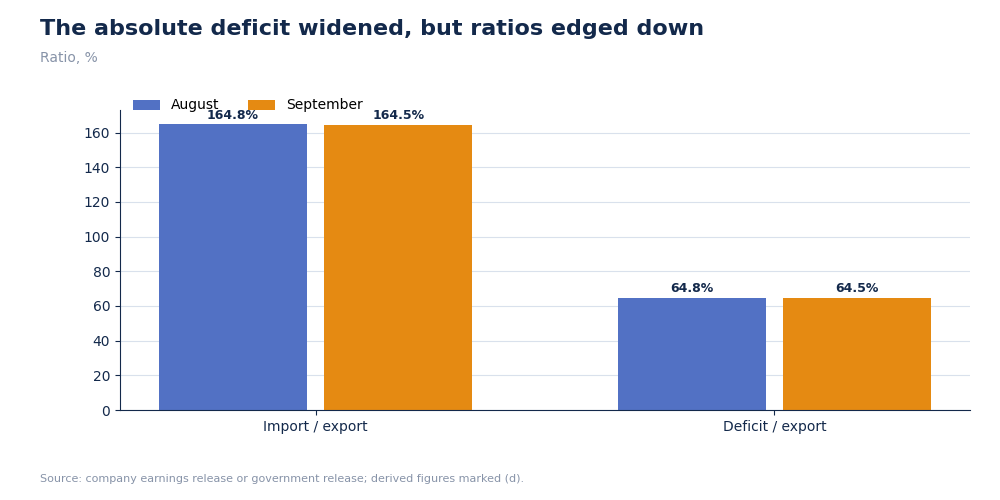
U.S. goods trade ratios, August and September 2026
The absolute deficit widened, but the import/export ratio edged down because exports grew 2.6% (d) versus 2.4% for imports (d). The dollar increase was larger for imports only because the import base is much bigger.
Why it matters. A larger deficit does not necessarily mean exports underperformed in percentage terms.
Source: U.S. Census Bureau Advance Economic Indicators, September 2026
Forensic #3: Wholesale Versus Retail Inventories
Inventory location matters. Upstream wholesale accumulation can precede retail restocking, or it can signal goods are not moving through the channel.
| Inventory | September level | m/m | y/y |
|---|---|---|---|
| Wholesale | $1,011.5B | +0.6% | +7.4% |
| Retail | $885.3B | +0.3% | +4.8% |
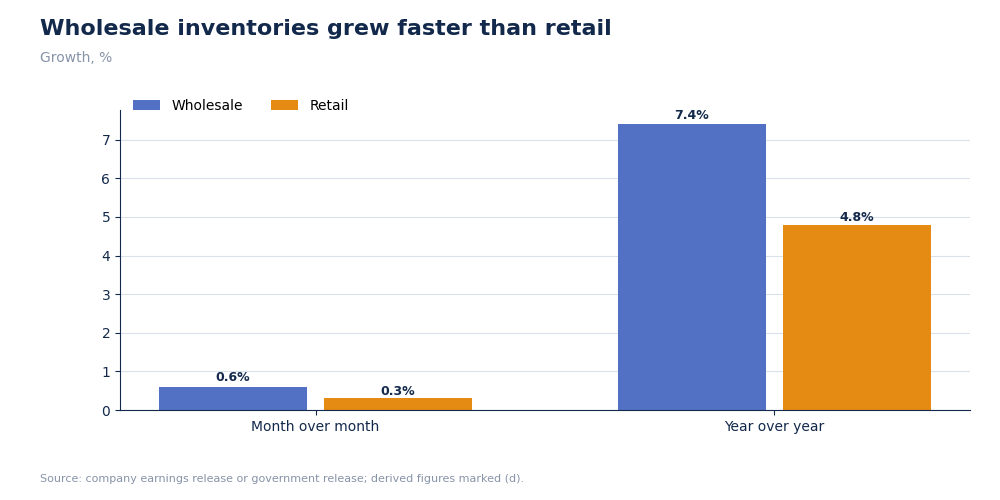
Advance wholesale and retail inventory growth
Wholesale inventory growth was twice the retail monthly rate and 2.6 points faster year over year. The wholesale stock exceeded retail by $126.2B (d).
Why it matters. The gap is a supply-chain signal that should be checked against sales before calling it either restocking or excess.
Source: U.S. Census Bureau Advance Economic Indicators, September 2026
Forensic #4: Nominal Versus Real Interpretation
The Census release explicitly says inventories are not adjusted for price changes. Nominal inventory can rise even when physical units do not.
| Data item | Seasonally adjusted | Price adjusted |
|---|---|---|
| Goods trade | Yes | No real-volume conclusion from opened release |
| Wholesale inventories | Yes | No |
| Retail inventories | Yes | No |
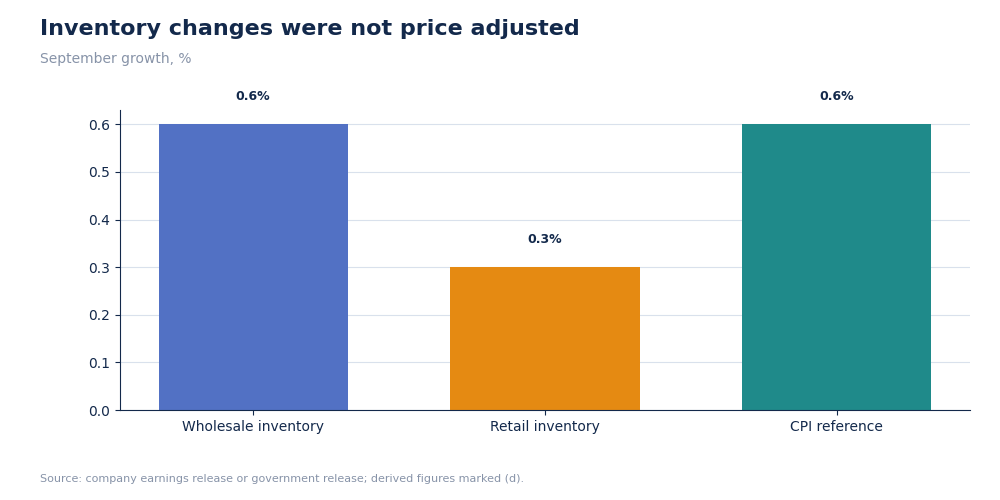
September advance indicators are nominal measures
With September CPI up 0.6% in the existing retail-sales article, part of the 0.6% wholesale inventory rise could be price rather than units. That is a conceptual comparison, not a deflator, because the inventory price mix differs from CPI.
Why it matters. Readers should not translate dollar inventory growth directly into real GDP contribution.
Source: U.S. Census Bureau Advance Economic Indicators, September 2026 and U.S. Bureau of Labor Statistics September 2026 CPI release
Valuation Snapshot
This is a macro article, so there is no security-specific multiple. The investment question is which earnings exposures benefit or suffer if imports, wholesale inventories and nominal prices continue rising together.
| Investment exposure | Data signal | Read-through |
|---|---|---|
| Domestic manufacturers | Goods deficit widened $2.8B | Import competition or strong domestic demand; category detail is required. |
| Retailers | Retail inventory +0.3% m/m | Less aggressive accumulation than wholesalers. |
| Distributors | Wholesale inventory +0.6% m/m | Working-capital risk if final sales slow. |
| Transport and logistics | Imports +$8.1B | Near-term volume support, subject to price effects. |
| GDP-sensitive cyclicals | Deficit widened | Potential net-export drag before revisions. |
Investment read-through. The most important signal is the two-speed inventory build: wholesale inventories are growing twice as fast month to month and 2.6 points faster year over year than retail. If sales do not accelerate, distributors face the earliest markdown and working-capital pressure. If the build reflects deliberate restocking, transport and industrial suppliers benefit first.
What has to be true. Higher imports and wholesale stocks must represent productive capital goods or demanded inventory rather than unwanted goods accumulating upstream.
Source: U.S. Census Bureau Advance Economic Indicators release for September 2026.
Risks: What Would Break The Thesis
- Advance estimate. The figures will be revised.
- Nominal data. Price changes can mimic volume.
- No composition table in the opened release. Product categories cannot be isolated.
- Inventory ambiguity. Restocking and weak sell-through look similar initially.
The interpretation would improve if later trade detail shows imports concentrated in capital goods and final sales remain firm.
What To Watch Next
- Final September trade release.
- Wholesale inventory-to-sales ratio.
- Retail inventory revisions.
- October import and export direction.
- Q3 GDP revisions to net exports and inventories.

Sandeep Gupta
Independent equity research analyst publishing forensic theses on US-listed stocks. MBA, Politecnico di Milano School of Management (Milan, Italy).
Get new research in your inbox
Subscribe to receive forensic equity research the moment it's published. Free, no spam.
Discussion
Be the first to comment.