
Investment Thesis
The 10-year Treasury yield closed at 5.024% on October 28, 2026, 1.15 percentage points above the midpoint of the Fed's 3.75% to 4.00% target range (d). The 2-year yield was 4.706% and the 30-year 5.351%. Two explanations compete: markets expect the Fed to keep raising rates, or investors demand extra compensation for holding long bonds, which Goldman Sachs vice chairman Robert Kaplan has called a "Warsh premium" after new Fed Chair Kevin Warsh. This article uses the yield curve to separate what the data can say from what it cannot, and explains why the distinction matters for mortgages, equity valuations and the Fed's own decisions.
- Curve. Fed funds midpoint 3.875%; 2-year 4.706%; 10-year 5.024%; 30-year 5.351%. Spreads: 2-year less funds +0.83, 10-year less 2-year +0.32, 30-year less 10-year +0.33 (all d).
- Policy. The Fed raised rates 25 basis points on September 16, its first hike since July 2023, and the dot plot showed one more increase in 2026. On October 28 it held, 10-2, with two members voting for a hike.
- Pricing. December hike probability 82.6% (CME FedWatch) to about 85%.
- Yield move. The 10-year was near 5.25% around October 1, close to its highest since 2007 and more than 100 basis points above a year earlier (Kaplan, via Mitrade), and was 5.024% on October 28.
- The claim. Kaplan says traders add a premium because they cannot yet gauge the new chair, who did not submit his own rate projection; he says the market may be overestimating what the Fed does.
- This article contains no rating, price target or investment advice. Every figure comes from a named source and anything I calculated is marked (d).
Bottom line. A 2-year yield 83 basis points above the funds rate cannot be explained by the December hike alone, because even if that hike lasted two years it would account for about 21 basis points (d). The other 62 basis points (d) are either further hikes the market expects or a premium for uncertainty. The data in this article cannot split them, because a term-premium estimate and the dot plot's longer-run rate were not available in what I read. What can be said is that the long end has repriced above the funds rate by more than the announced policy path explains.
Sources: Kiplinger; Federal Reserve, Oct 28, 2026; Mitrade, on Kaplan's remarks; InvestingLive, on the September dot plot.
The Curve At A Glance
| Measure | Level (Oct 28) | Spread to funds midpoint (d) |
|---|---|---|
| Fed funds target range | 3.75% to 4.00% (midpoint 3.875%) | n/a |
| 2-year Treasury | 4.706% | +0.83 |
| 10-year Treasury | 5.024% | +1.15 |
| 30-year Treasury | 5.351% | +1.48 |
| 10-year less 2-year (d) | +0.32 | n/a |
| 30-year less 10-year (d) | +0.33 | n/a |
Sources: Kiplinger; Federal Reserve. Spreads are my arithmetic (d).
What The Market Believes vs. What The Data Actually Shows
| Belief | What the data show |
|---|---|
| High yields reflect Fed hikes | The 2-year is 83 basis points above the funds midpoint (d). The December hike (25 basis points, about 83% likely) accounts for at most 21 of them (d). |
| High long yields are a bond-vigilante reaction to deficits | Kaplan, quoted by Mitrade, attributes part of the rise to uncertainty about the new chair and to diesel prices, not to one cause; the extracts I read give no deficit figures. |
| The Fed is losing control of the long end | The Fed's September dot plot showed one more 2026 hike, and the 10-year fell from about 5.25% to 5.02% between early October and October 28 (d: 23 basis points) without a change in policy. |
| A hawkish Fed lifts mortgage rates one for one | Freddie Mac's 30-year rate was 7.28% on October 1 and 7.24% on October 29, a 4 basis point change against a 23 basis point fall in the 10-year (d), so the link is looser than one to one over this window. |
The fourth row compares dates that are not identical (the 10-year level on October 1 is approximate, from Kaplan), so it supports only the conclusion that mortgage rates did not fall by as much as the Treasury yield.
Forensic #1: The Shape Of The Curve
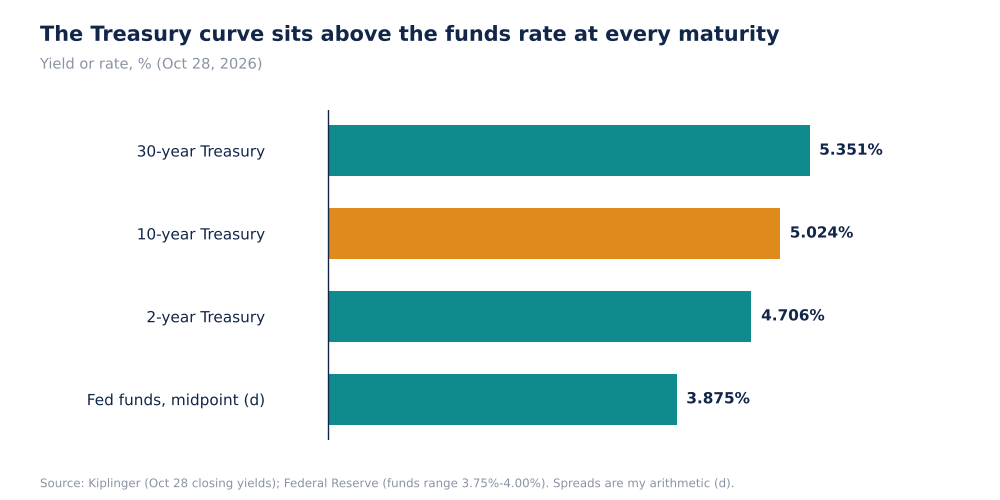
Treasury Yields And Fed Funds Midpoint, Oct 28, 2026 (Self-Made)
An upward-sloping curve in a tightening cycle is unusual. When the Fed raises rates to restrain inflation, investors often expect the policy to work and push long yields below short ones. Here the curve slopes up at every point: 10-year less 2-year is +0.32 and 30-year less 10-year +0.33 (d). That pattern indicates that investors expect rates to stay higher for longer, or inflation to be higher, or both, rather than expecting the Fed's tightening to lead to a slowdown. September CPI was 3.7% year over year, so a 10-year yield of 5.024% is only about 1.3 points above inflation (d).
Why it matters. The shape of the curve is the market's verdict on the policy mix. A curve that slopes up after a hike suggests the market is not yet convinced that inflation is under control.
Sources: Kiplinger; Federal Reserve; BLS CPI for September 2026 (see Stocknote's Fed article). Spreads are mine (d).
Forensic #2: Expectations Versus Premium
| Step | Percentage points (d) |
|---|---|
| Funds midpoint | 3.875 |
| Add: December hike, 25 bp x 83% probability, held for two years (upper bound) | +0.208 |
| Add: everything else (more hikes, term premium, or both) | +0.623 |
| 2-year yield | 4.706 |
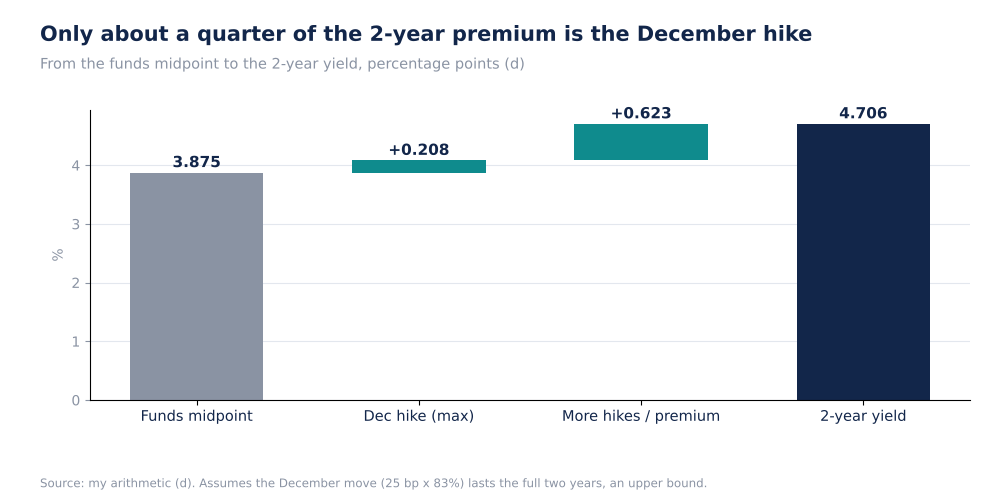
Funds Midpoint To 2-Year Yield, Percentage Points (Self-Made, d)
The decomposition uses the expectations hypothesis, the idea that a 2-year yield is approximately the average expected short rate over two years plus a term premium. I assume the December hike (25 basis points, weighted by the 83% probability, which is 0.208 points, d) lasts the full two years. That gives the largest contribution that a single hike can make to the average. The rest, 0.623 points (d), has to come from additional hikes that the market expects beyond December or from the premium. The dot plot showed only one more hike in 2026, so for it to be additional hikes, the market has to expect more tightening than the Fed's median projection, as Kaplan suggests may be the case when he says the market may be overestimating what the Fed does.
Why it matters. If the 0.62 points were mostly additional hikes, then easing inflation data could remove them quickly and yields would fall. If they were mostly premium for uncertainty about the chair, then policy communication would matter more than data. The two readings lead to different outcomes for bond, mortgage and equity investors, and this article cannot choose between them.
Sources: Kiplinger; InvestingLive; Mitrade. The decomposition is my arithmetic and a simplification.
Forensic #3: Slope And Spreads
| Spread | Percentage points (d) | What it measures |
|---|---|---|
| 2-year less funds midpoint | +0.83 | Expected policy path plus short-end premium |
| 10-year less 2-year | +0.32 | Expected path in years 3 to 10 plus premium |
| 30-year less 10-year | +0.33 | Very long horizon premium and inflation risk |
| 10-year less funds midpoint | +1.15 | Total gap between long yields and policy |
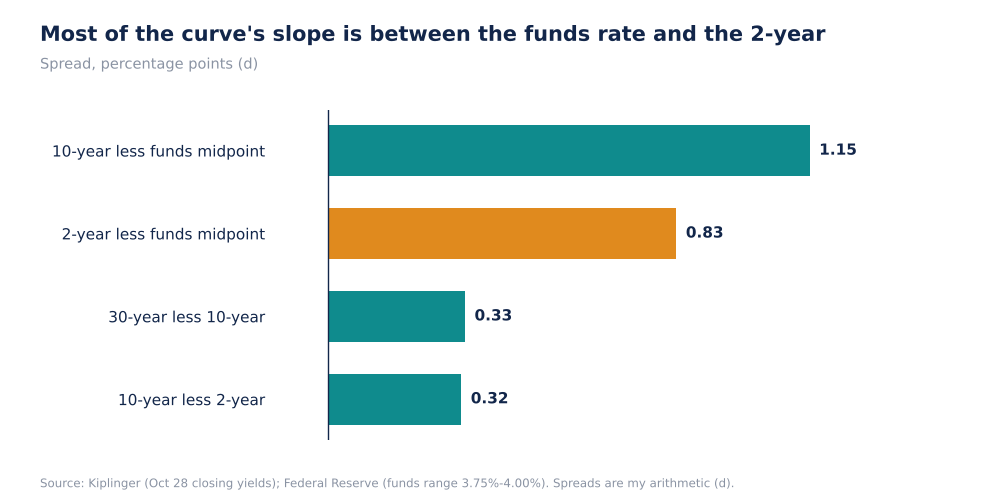
Yield Spreads, Percentage Points (Self-Made, d)
The 2-year spread of 0.83 points (d) accounts for 72% of the 1.15 point gap between the 10-year and the funds rate (d). That means about 0.32 points (d) is the extra yield for lending for eight more years after the second. A forward calculation would give the same message: the average expected rate and premium for years three to ten is close to 5.1% (d, computed as (10 × 5.024 - 2 × 4.706) / 8 = 5.10%). The calculation is approximate (it ignores compounding), but it shows that the market's implied rate for the later years is above the current 2-year yield and not below it.
Why it matters. If investors expected the Fed to engineer a slowdown, the forward rate for later years would be lower. It is higher. The bond market is therefore pricing a regime in which the funds rate settles well above the current 3.875%, either because of policy or because investors want more compensation for time.
Sources: Kiplinger. Forward rate is my approximation (d): (10 x 5.024 - 2 x 4.706) / 8 = 5.10%.
Forensic #4: What The Yield Does To Borrowers
| Date | 30-year mortgage rate (Freddie Mac) | Year-ago rate |
|---|---|---|
| Oct 1, 2026 | 7.28% | 6.34% |
| Oct 15, 2026 | 7.40% | 6.27% |
| Oct 22, 2026 | 7.32% | 6.19% |
| Oct 29, 2026 | 7.24% | 6.17% |
The mortgage rate on October 29 was 7.24%, which is 2.22 points above the 10-year yield of 5.024% on October 28 (d), and 1.07 points above the rate a year earlier (d). Freddie Mac's 30-year rate had gone eight consecutive weeks without a decline by mid-October, and the first decline in nine weeks came on October 22, according to Trading Economics. The housing article in this series examines what this does to sales and affordability.
Why it matters. The term premium is not an abstract concept for households: it determines mortgage and corporate borrowing rates. Even if the Fed pauses after December, a premium that stays in the 10-year keeps financing costs high.
Sources: Trading Economics, Freddie Mac weekly series; Kiplinger. The spread is my arithmetic (d); the mortgage and Treasury dates differ by one day.
Valuation Snapshot
This is a macro article. The relevant market levels are in the table.
| Measure | Level |
|---|---|
| Fed funds range | 3.75% to 4.00% |
| 2-year / 10-year / 30-year | 4.706% / 5.024% / 5.351% |
| December hike probability | 82.6% to about 85% |
| Freddie Mac 30-year mortgage (Oct 29) | 7.24% |
| S&P 500 (Oct 28) | 7,743 |
| September CPI, 12 months | 3.7% |
What has to be true. For yields to fall without a change in the Fed's path, either inflation has to ease enough that investors accept lower compensation, or the chair's reaction function has to become clearer so that any uncertainty premium shrinks. For yields to rise, one of two things must happen: inflation stays near 3.7%, or the Fed signals more than one further hike.
Risks: What Would Break The Thesis
- No term-premium estimate. I did not retrieve the New York Fed model figures, so the split between expectations and premium is an upper-bound calculation.
- Single source for the claim. The premium argument is Kaplan's, reported by Mitrade; the headline claim that it costs the Fed 100 basis points is not explained in the article.
- Date mismatch. Yields are from October 28, mortgage rates from October 29, the 10-year level around October 1 is approximate.
- Oil. Kaplan links yields to diesel prices and the Iran conflict; a sharp fall in oil could lower yields regardless of the Fed.
- Method. The expectations hypothesis is a simplification; the forward rate ignores convexity and compounding.
The analysis could be wrong if investors expect substantially more than the dot plot's one further hike, in which case most of the premium is policy expectations and would fall with softer data.
What To Watch Next
- The December FOMC decision, priced at 82.6% to about 85%, and the updated dot plot.
- The 10-year yield relative to 5.0%, and the 2-year relative to 4.7%.
- October CPI, due November 10, against September's 3.7%.
- Any estimate of the term premium from the New York Fed or others, to split expectations from premium.
- Diesel and crude prices, which Kaplan identified as a driver.
- Freddie Mac's weekly rate relative to 7.24%.

Sandeep Gupta
Independent equity research analyst publishing forensic theses on US-listed stocks. MBA, Politecnico di Milano School of Management (Milan, Italy).
Get new research in your inbox
Subscribe to receive forensic equity research the moment it's published. Free, no spam.
Discussion
Be the first to comment.