
Investment Thesis
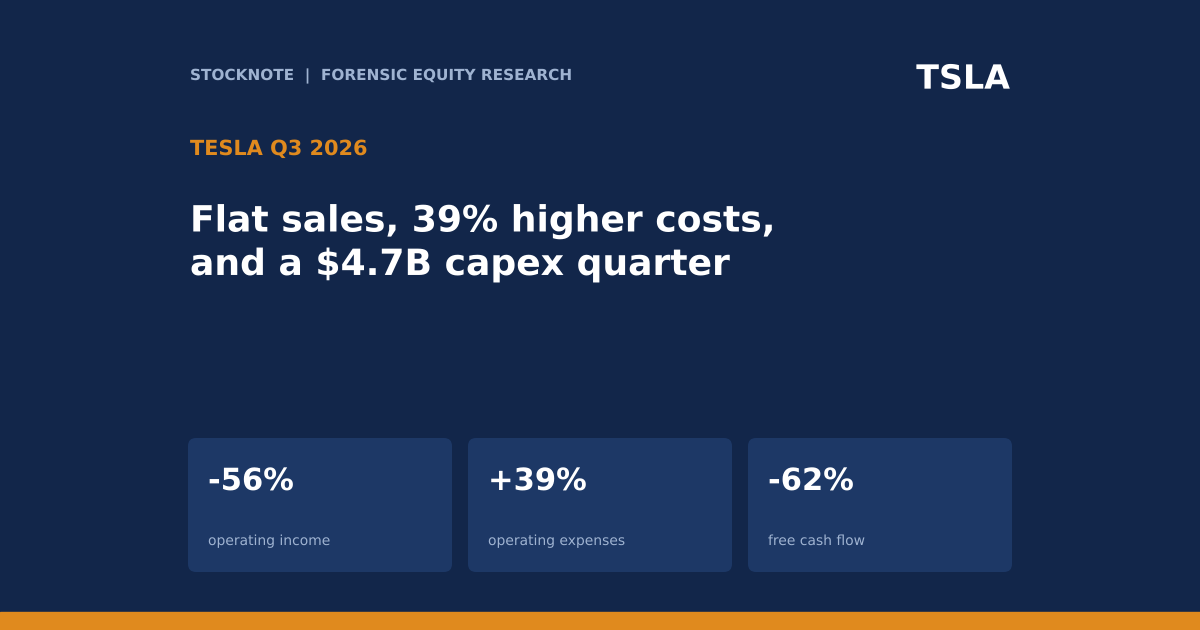
Tesla's third-quarter revenue was flat at $28.0B, yet operating income fell 56% because operating expenses grew 39%, capital spending more than doubled, and free cash flow fell 62%. The quarter beat low estimates on margin and cash flow, but the profit that remains is smaller and the spending is larger.
- Flat sales. Total revenues were $28,046M against $28,095M a year ago (-0.2%). Deliveries fell 2.1% to 486,532 vehicles while production rose 3.8% to 464,391.
- Margin gain, profit loss. Gross profit rose 8.7% to $5,494M, lifting gross margin to 19.6% from 18.0% (derived). But operating expenses rose $1,346M, three times the $440M gain in gross profit, so operating income fell from $1,624M to $718M.
- Capex. Capital expenditures rose 111% to $4,732M. Operating cash flow was flat at $6,263M, so free cash flow fell from $3,990M to $1,531M. Capex took 76% of operating cash flow, against 36% a year ago (derived).
- Earnings quality. GAAP net income was $787M (-43%) and non-GAAP net income was $1,697M (-4%). The $910M gap between them is larger than the $397M gap a year ago (derived). Pre-tax stock-based compensation rose 76% to $1,165M.
- Mix. Services and other revenue rose 32.5% to $4,605M, while energy generation and storage fell 15.6% to $2,881M and regulatory credits fell from $417M to $113M.
- Balance sheet. Cash and short-term investments were $45,447M, up $3,800M from a year ago and up $1.9B from the second quarter.
- This article contains no price target or rating. Every figure comes from Tesla's own Q3 2026 update or a named source, and anything I calculated is marked (d).
Bottom line. Tesla's quarter is better read as a spending story than an earnings story. Gross profit rose $440M, but $1,346M of extra operating expenses and $2,484M of extra capex absorbed that gain before it reached cash. Investors are being asked to fund the spending in the expectation that revenue growth follows, and Q3 did not show that yet.
Source: Tesla Q3 2026 Update, Exhibit 99.1 to Form 8-K, Oct 21, 2026.
Q3 2026 At A Glance
Revenue was flat, gross margin improved, and everything below gross profit moved the wrong way.
| Metric (quarter ended Sept 30) | Q3 2026 | Q3 2025 | Change |
|---|---|---|---|
| Total revenues | $28,046M | $28,095M | -0.2% (d) |
| Gross profit | $5,494M | $5,054M | +8.7% (d) |
| Operating expenses | $4,776M | $3,430M | +39.2% (d) |
| Income from operations | $718M | $1,624M | -55.8% (d) |
| Operating margin | 2.6% (d) | 5.8% (d) | -322 bp |
| Net income, GAAP / non-GAAP | $787M / $1,697M | $1,373M / $1,770M | -43% / -4% (d) |
| Diluted EPS, GAAP / non-GAAP | $0.22 / $0.48 | $0.39 / $0.50 | -44% / -4% (d) |
| Adjusted EBITDA (margin) | $3,900M (13.9%) | $4,227M (15.0%) | -7.7% (d) |
| Operating cash flow | $6,263M | $6,238M | +0.4% (d) |
| Capital expenditures | $4,732M | $2,248M | +111% (d) |
| Free cash flow | $1,531M | $3,990M | -62% (d) |
| Deliveries / production (vehicles) | 486,532 / 464,391 | 497,099 / 447,450 | -2.1% / +3.8% (d) |
| Storage deployed | 13.7 GWh | 12.5 GWh | +9.6% (d) |
(d) = derived by me from printed figures. Operating margin change of -322 bp and gross margin change of +160 bp are as printed by Tesla. Source: Tesla Q3 2026 Update.
What The Market Believes vs. What The Data Actually Shows
The headline was a beat on margin and cash flow. Against what analysts expected, that is true. Against last year, profit and cash flow both fell.
| Item | Actual | Expected (investinglive) | Year ago |
|---|---|---|---|
| Adjusted EPS | $0.48 | $0.44 | $0.50 |
| Revenue | about $28.05B | roughly $28.13B | $28.10B |
| Gross margin | 19.6% | 17.8% | 18.0% (d) |
| Operating income | about $720M | roughly $600M | $1,624M |
| Free cash flow | about $1.5B | outflow of about $5B | $3,990M |
| Energy generation and storage revenue | about $2.9B | roughly $3.9B | $3,415M |
Free cash flow of $1.5B looks like a large beat only because the comparison was an expected outflow of about $5B. Measured against last year, it fell 62%. Operating income beat by about $120M but is still less than half of last year's. Energy revenue missed by about $1B on the same comparison.
Tesla gave no numeric guidance in the update I read. Its stated focus is "maximum capacity utilization at our factories" and reaching 400 MW of "SI" training compute by the end of the year.
Sources: Tesla Q3 2026 Update; investinglive for estimates (the article labels only the EPS figure as consensus; I treated its other comparisons as expected values).
The gap between the headline and the trend is the key point. Against estimates the quarter looked good, because the free cash flow estimate assumed an outflow of about $5B. Against last year, operating income, GAAP net income and free cash flow all fell. An investor who anchors on the year-over-year change instead of the estimate gets a very different picture, and this article uses the year-over-year view.
Forensic #1: Gross Profit Rose $440M, Operating Expenses Rose $1,346M
Tesla improved gross margin by 160 basis points, but the extra gross profit was consumed three times over by higher operating expenses.
| Line | Q3 2026 | Q3 2025 | Change |
|---|---|---|---|
| Gross profit | $5,494M | $5,054M | +$440M |
| Operating expenses | $4,776M | $3,430M | +$1,346M |
| Income from operations | $718M | $1,624M | -$906M |
| Operating expenses as % of revenue | 17.0% (d) | 12.2% (d) | +4.8 pts |
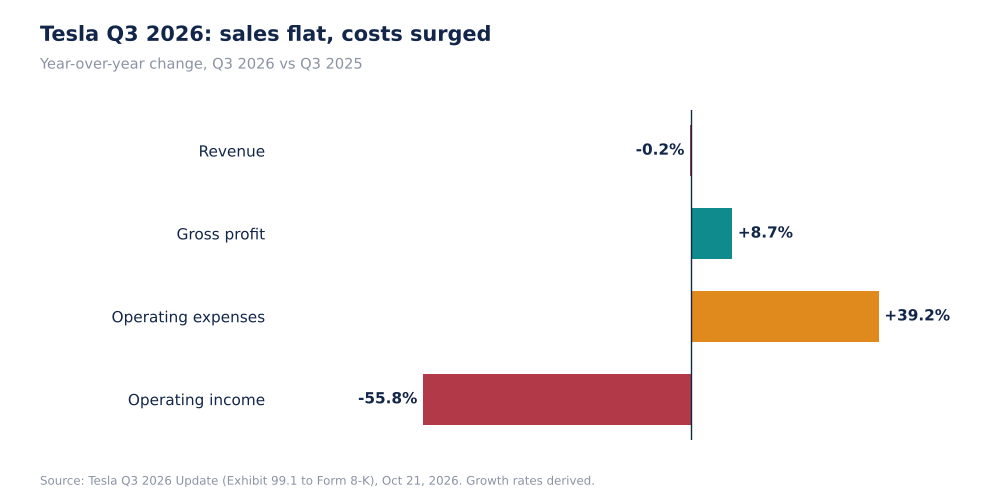
Tesla Q3 2026 Growth In Revenue, Gross Profit, Operating Expenses And Operating Income (Self-Made)
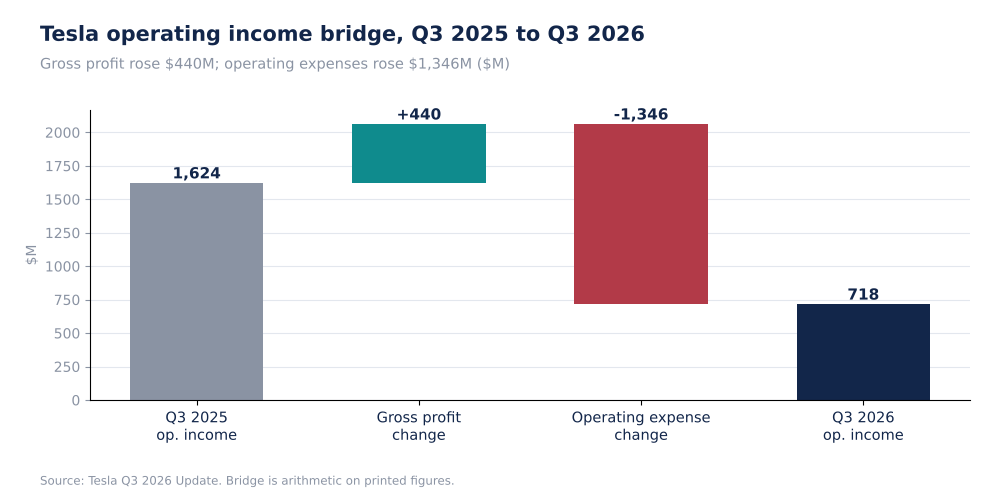
Tesla Operating Income Bridge, Q3 2025 To Q3 2026, $M (Self-Made)
The figures I extracted from the update do not break down the $1,346M increase in operating expenses, so I do not attribute it to any single cause. For scale, pre-tax stock-based compensation rose $502M to $1,165M, equal to 4.2% of revenue against 2.4% a year ago (derived). The update does not say how much of that sits in operating expenses, so I make no claim on that link.
Why it matters. Operating income is the $5,494M of gross profit less $4,776M of expenses, so each additional $1B of operating income needs about $1B more gross profit, or about $5.1B more quarterly revenue at the current 19.6% gross margin (d). With revenue flat, the margin gain alone cannot close that gap, so the direction of operating expenses is the variable that decides the next few quarters of profit.
Source: Tesla Q3 2026 Update.
Forensic #2: Revenue Was Flat Because Services Growth Offset Declines In Cars, Energy And Credits
The $49M decline in revenue hides large moves underneath. Services and other revenue added $1,130M while the other three lines took away $1,179M.
| Revenue line | Q3 2026 | Q3 2025 | Change |
|---|---|---|---|
| Automotive revenues (total) | $20,560M | $21,205M | -$645M (-3.0%) |
| of which regulatory credits | $113M | $417M | -$304M (-73%) |
| Automotive ex-credits (d) | $20,447M | $20,788M | -$341M (-1.6%) |
| Energy generation and storage | $2,881M | $3,415M | -$534M (-15.6%) |
| Services and other | $4,605M | $3,475M | +$1,130M (+32.5%) |
| Total revenues | $28,046M | $28,095M | -$49M |
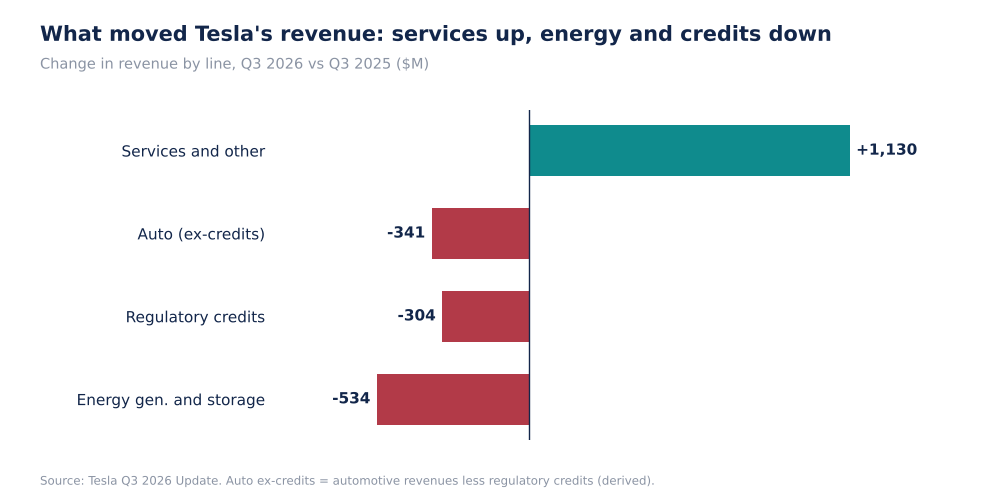
Change In Tesla Revenue By Line, Q3 2026 vs Q3 2025, $M (Self-Made)
Services and other is now 16.4% of revenue, up from 12.4% (derived). The update I read does not state the margin on regulatory credits, so I do not estimate their effect on profit. Automotive gross margin improved to 18.5% from 17.0% even with fewer credits.
Storage deployments rose 9.6% to 13.7 GWh (The EV Report, citing Tesla's update) while energy generation and storage revenue fell 15.6%. Revenue per GWh deployed was about $210M against $273M (derived), but the revenue line also includes solar and other energy products that I cannot separate, so treat this as a rough indicator, not a price.
Why it matters. The mix is moving toward services, which grew 32.5%, and away from energy and credits. Services and other is still only 16.4% of revenue, so it would have to keep growing at this pace for several quarters to offset a decline the size of energy (-$534M) and credits (-$304M) together. Automotive revenue per delivery fell about 1% (d), so the vehicle business is not offsetting through price either.
Sources: Tesla Q3 2026 Update; The EV Report for storage detail.
Forensic #3: Capex Doubled And Free Cash Flow Fell 62%
Operating cash flow was almost unchanged, but Tesla spent $2,484M more on capital expenditures than a year ago.
| Cash flow ($M) | Q3 2026 | Q2 2026 | Q3 2025 |
|---|---|---|---|
| Net cash from operating activities | 6,263 | 4,697 | 6,238 |
| Capital expenditures | (4,732) | (5,789) | (2,248) |
| Free cash flow | 1,531 | (1,092) | 3,990 |
| Free cash flow margin | 5.5% (d) | -3.9% (d) | 14.2% (d) |
| Capex as % of operating cash flow | 76% (d) | 123% (d) | 36% (d) |
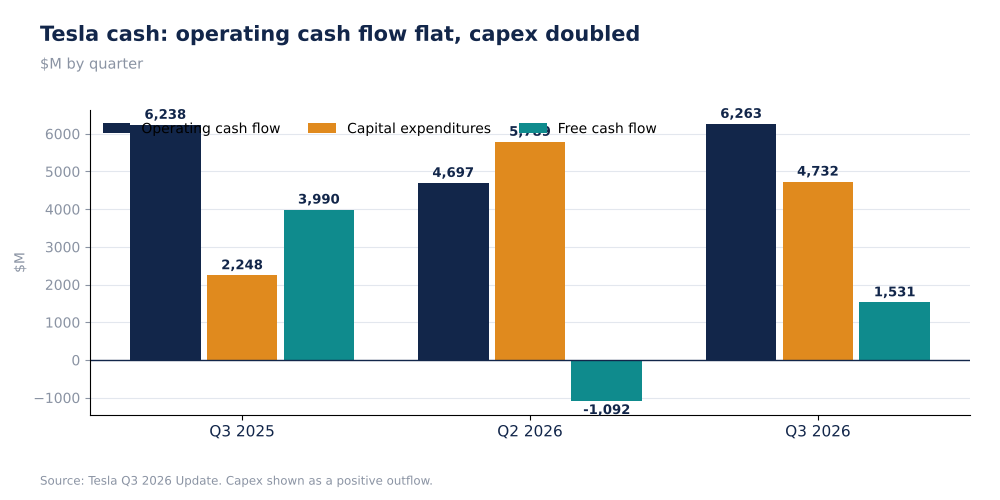
Tesla Operating Cash Flow, Capital Expenditures And Free Cash Flow By Quarter, $M (Self-Made)
Free cash flow was negative $1,092M in the second quarter, so the third-quarter figure is a recovery from a loss, not a return to last year's level. Capex was $4,732M against a $5,789M peak in the second quarter. The update gave no numeric capex guidance (The EV Report), so I cannot say whether spending will keep falling.
Why it matters. Free cash flow is what funds buybacks, acquisitions or further investment, and Tesla generated $1,531M of it against $45.4B of cash. The cash balance equals about 9.6 quarters of capex at the Q3 rate (d), so liquidity is not the issue. The issue is return: $4.7B of capex in a quarter has to earn a return that the current income statement does not yet show.
Source: Tesla Q3 2026 Update.
Forensic #4: GAAP And Non-GAAP Earnings Moved Apart
GAAP net income fell 43% while non-GAAP net income fell 4%. The adjustments added back $910M this quarter against $397M last year.
| Net income attributable to common ($M) | Q3 2026 | Q3 2025 |
|---|---|---|
| GAAP | 787 | 1,373 |
| Non-GAAP | 1,697 | 1,770 |
| Gap (d) | 910 | 397 |
| Stock-based compensation, net of tax | 982 | 459 |
| Stock-based compensation, pre-tax | 1,165 | 663 |
The update prints stock-based compensation net of tax of $982M next to this reconciliation, which is larger than the $910M gap. I did not extract the reconciliation line by line, so I cannot say how the two relate. For scale, $982M equals about 58% of non-GAAP net income (derived), so stock compensation is material to which earnings number a reader chooses.
Why it matters. The choice of earnings measure changes the valuation by a factor of about 2.2, because non-GAAP net income of $1,697M is 2.2 times GAAP net income of $787M (d). Investors who use non-GAAP earnings are relying on a figure that excludes a stock compensation cost that rose 76% in a year. A reader should decide which measure they trust before applying any multiple.
Source: Tesla Q3 2026 Update.
Valuation Snapshot
TradingView shows Tesla at $399.81, down 0.87% on the day, with a market cap of about $1.58T. That value is large against the quarter's cash generation.
| Measure | Figure |
|---|---|
| Share price (TradingView) | $399.81 |
| Market cap (TradingView) | about $1.58T |
| P/E on GAAP trailing EPS of $1.00 (TradingView) | about 444x |
| Market cap / annualised Q3 revenue of $112.2B (d) | about 14.1x |
| Annualised Q3 free cash flow yield (d) | about 0.4% |
| Annualised Q3 operating cash flow yield (d) | about 1.6% |
| Cash and short-term investments as % of market cap (d) | about 2.9% |
At this market cap each $1 of annualised Q3 free cash flow is priced at about $258 (d). The valuation therefore rests on growth that the Q3 numbers do not yet show: revenue was flat, operating income fell 56% and free cash flow fell 62%.
What has to be true. At a market cap near $1.58T, the market is paying for operating income and free cash flow many times the Q3 level. The evidence investors can check is whether operating expenses stop outgrowing gross profit and whether capex begins to convert into revenue. Until one of those appears, the valuation depends on assumptions that are not in the reported numbers.
Risks: What Would Break The Thesis
- Operating expenses fall back. If the $4,776M proves a one-off, operating margin would recover and the thesis of lower earnings quality would weaken.
- Capex yields growth. Capital spending of $4.7B in a quarter would look different if revenue growth follows. The update gave no guidance on that link.
- Energy rebound. Tesla reported its highest-ever storage order rate and backlog (The EV Report, as attributed to Tesla, no figures given). If deployments convert into higher revenue, the energy decline reverses.
- Services scale. Services and other grew 32.5%. If it keeps growing at that pace, the flat top line would turn positive.
- Data limits. I did not read the 10-Q or the call transcript.
The risks cut both ways. The bearish ones are in the figures: flat sales, 39% higher costs and doubled capex. The risk to a cautious view is that services and storage, where management described record order rates, convert into revenue faster than the Q3 figures suggest.
What To Watch Next
- The 10-Q breakdown of operating expenses and what drove the $1,346M increase.
- Q4 capex against $4,732M and any 2026 capex figure given on the call.
- Energy revenue per GWh and whether storage deployments keep rising above 13.7 GWh.
- Regulatory credit revenue, which fell to $113M.
- The gap between GAAP and non-GAAP net income, currently $910M.

Sandeep Gupta
Independent equity research analyst publishing forensic theses on US-listed stocks. MBA, Politecnico di Milano School of Management (Milan, Italy).
Get new research in your inbox
Subscribe to receive forensic equity research the moment it's published. Free, no spam.
Related Research
 HON
Honeywell (HON): Adjusted EPS Up 34%, GAAP EPS Down 20%, And Operating Cash Flow Down 74%
 GE
GE Aerospace (GE): Orders Up 49% And Adjusted EPS Up 36%, But Free Cash Flow Fell 14% And The Guide Implies A Softer Q4
 LMT
Discussion
Be the first to comment.