
Investment Thesis
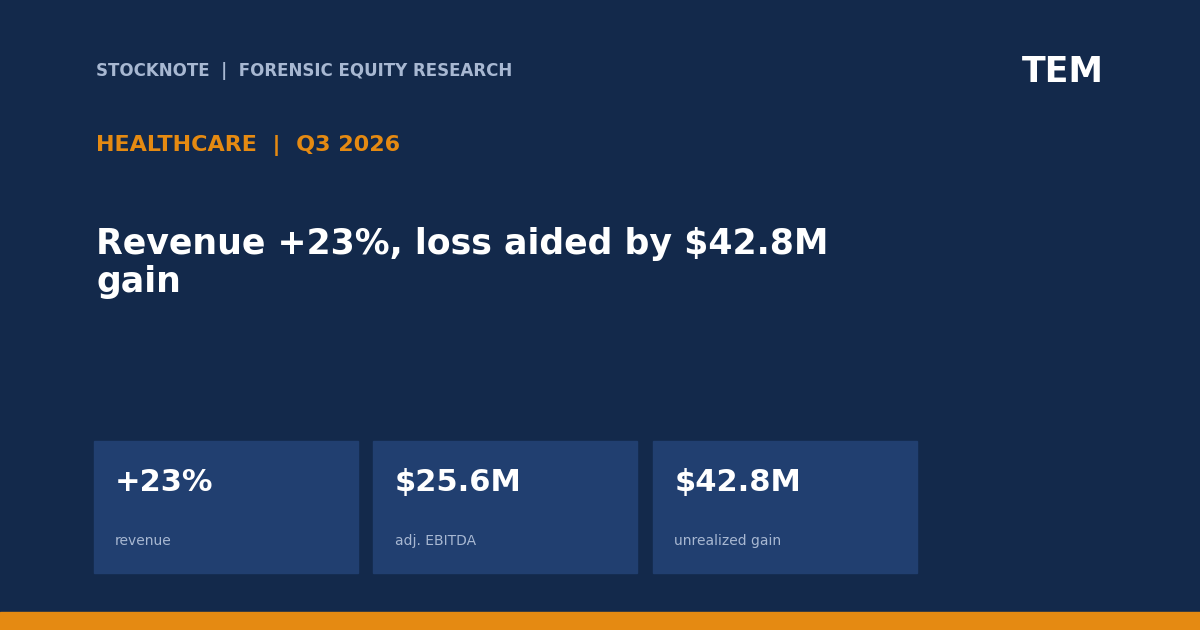
Tempus AI reported Q3 2026 revenue of $411.5M, up 23%, gross profit of $266.7M and adjusted EBITDA of $25.6M. Diagnostics grew 20% and Data & Applications 33%. The GAAP net loss narrowed to $14.9M from $80.0M, but it included a $42.8M unrealized gain on marketable securities and $50.8M of stock compensation and related payroll taxes. At the operating line, the loss was still $56.9M.
- Revenue. $411.5M, +23%.
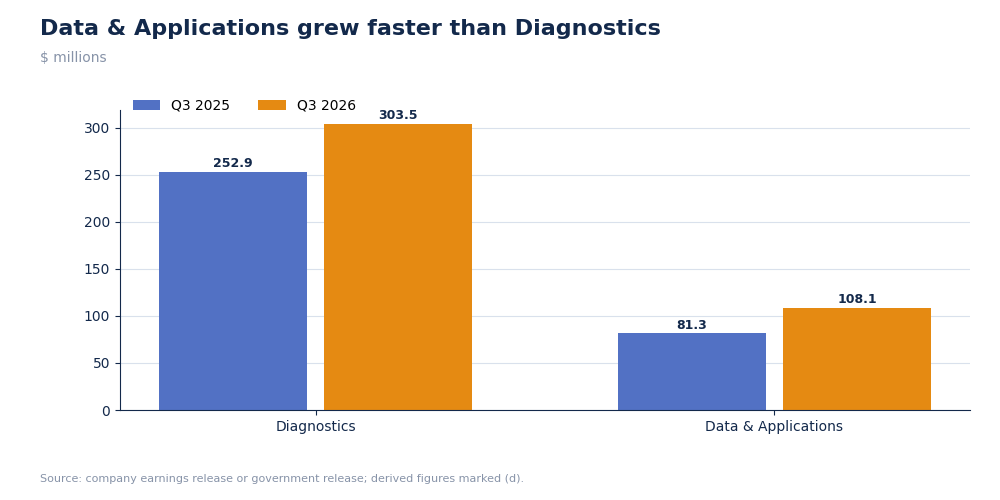
- Mix. Diagnostics $303.5M, +20%; Data & Applications $108.1M, +33%.
- Profit. Gross profit $266.7M; operating loss $56.9M; net loss $14.9M.
- Adjustments. $42.8M unrealized gain and $50.8M stock compensation/payroll taxes.
- Cash. Nine-month operating cash use $71.6M; cash and securities $854.4M.
- This article contains no rating, price target or investment advice. Derived figures are marked (d).
Bottom line. The platform is scaling and adjusted EBITDA is positive, but GAAP loss improvement is not yet the same as operating profitability. The unrealized gain offset most of the operating loss below the line, while stock compensation remains a large recurring economic cost.
Source: Tempus AI Q3 2026 earnings release (8-K Ex. 99.1).
Q3 2026 At A Glance
| Measure | Q3 2026 | Q3 2025 |
|---|---|---|
| Revenue | $411.5M | $334.2M |
| Gross profit | $266.7M | $210.0M (d) |
| Operating loss | -$56.9M | -$61.0M |
| Net loss | -$14.9M | -$80.0M |
| Adjusted EBITDA | $25.6M | $1.5M |
| Cash and securities | $854.4M |
Source: Tempus AI Q3 2026 earnings release (8-K Ex. 99.1). Derived figures are marked (d).
What The Market Believes vs. What The Data Actually Shows
| Belief | What the data show |
|---|---|
| The net-loss improvement came from operations | A $42.8M unrealized securities gain materially reduced the loss. |
| Diagnostics is the growth engine | Data & Applications grew faster at 33% and carries a higher gross margin (d). |
| Positive adjusted EBITDA means positive cash flow | Nine-month operating cash flow was -$71.6M. |
| Oncology volume growth equals revenue growth | Oncology volume grew 32%, faster than Diagnostics revenue at 20%, implying mix or reimbursement pressure. |
Forensic #1: Segment Growth And Mix
A platform with diagnostics and data should gain operating leverage when the higher-margin data line grows faster.
| Segment | Q3 2025 | Q3 2026 | Growth |
|---|---|---|---|
| Diagnostics | $252.9M | $303.5M | +20% |
| Data & Applications | $81.3M | $108.1M | +33% |
| Total | $334.2M | $411.5M | +23% |
Tempus revenue by segment, Q3
Data & Applications grew 13 points faster than Diagnostics and increased its revenue share from 24.3% to 26.3% (d).
Why it matters. Mix shift toward data can lift consolidated gross margin and reduce dependence on test reimbursement.
Source: Tempus AI Q3 2026 earnings release (8-K Ex. 99.1)
Forensic #2: Gross Margin By Segment
Gross margin measures the revenue left after the direct cost of tests and data delivery. It identifies the economic value of mix.
| Segment | Revenue | Cost of revenue | Gross margin (d) |
|---|---|---|---|
| Diagnostics | $303.5M | $114.0M | 62.4% |
| Data & Applications | $108.1M | $30.8M | 71.5% |
| Total | $411.5M | $144.8M | 64.8% |
Tempus Q3 2026 gross margin by segment
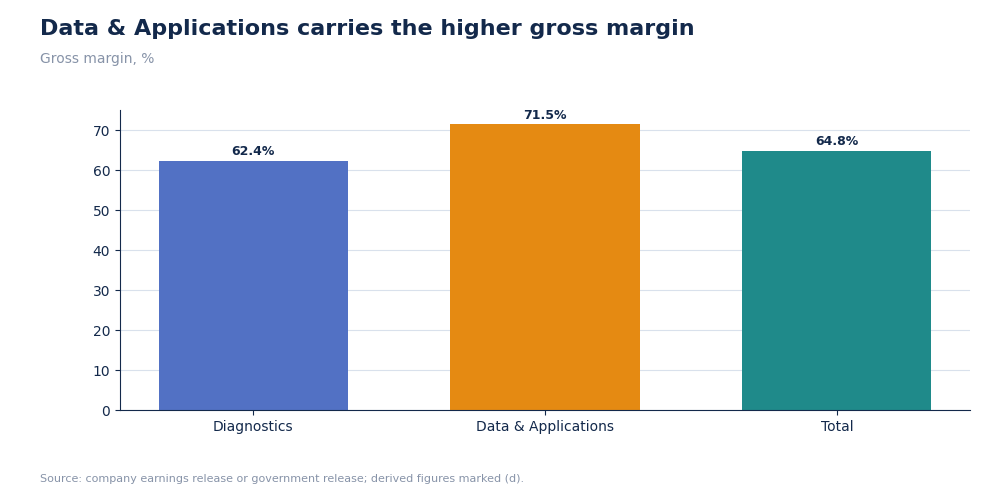
Data & Applications earned a gross margin about 9.1 points above Diagnostics (d). Because it grew faster, mix contributed positively to the consolidated 64.8% gross margin (d).
Why it matters. The faster-growing segment is also the more profitable one before operating expenses.
Source: Tempus AI Q3 2026 earnings release (8-K Ex. 99.1)
Forensic #3: Operating Loss Versus Net Loss
Below-the-line gains can make net income look better than operating economics. Separating them prevents extrapolating market gains as recurring earnings.
| Earnings item | Q3 2026 |
|---|---|
| Operating loss | -$56.9M |
| Interest income | $4.0M |
| Interest expense | -$6.7M |
| Other income | $47.1M |
| Unrealized securities gain inside net loss | $42.8M |
| Net loss | -$14.9M |
Tempus Q3 operating and net loss bridge
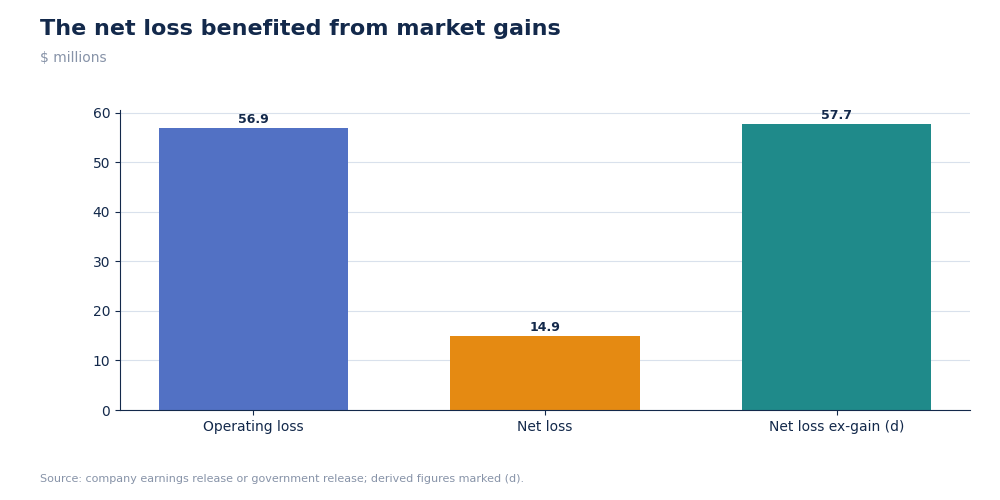
The net loss was $42.0M smaller than the operating loss (d), almost entirely because of other income. Without the $42.8M unrealized gain, the net loss would have been about $57.7M (d), close to the operating loss.
Why it matters. The operating line is the cleaner measure of current business profitability.
Source: Tempus AI Q3 2026 earnings release (8-K Ex. 99.1)
Forensic #4: Adjusted EBITDA And Cash Burn
Adjusted EBITDA adds back non-cash and selected expenses, while operating cash includes working-capital timing. Both are needed for a scaling company.
| Measure | Q3 / YTD 2026 |
|---|---|
| Q3 adjusted EBITDA | $25.6M |
| Q3 operating loss | -$56.9M |
| Q3 stock compensation + payroll taxes | $50.8M |
| Nine-month operating cash flow | -$71.6M |
| Cash and securities | $854.4M |
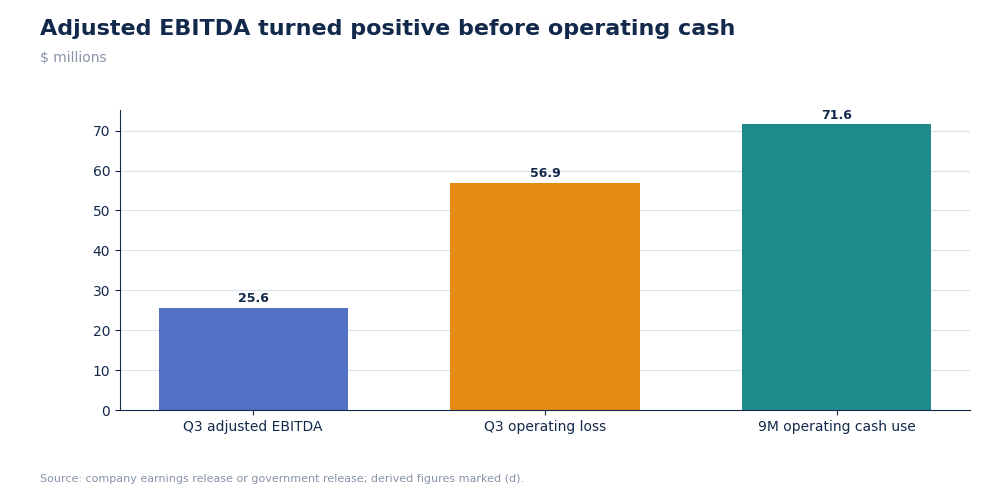
Tempus adjusted EBITDA, operating loss and cash use
Positive adjusted EBITDA coexists with a GAAP operating loss because the adjustment set is large. Nine-month cash use improved from $181.3M to $71.6M, a $109.7M improvement (d), which is meaningful even though cash flow remains negative.
Why it matters. The next quality milestone is positive operating cash, not a higher adjusted EBITDA alone.
Source: Tempus AI Q3 2026 earnings release (8-K Ex. 99.1)
Valuation Snapshot
At $78.48 per share, Tempus had a market capitalization of $14.31B. Because earnings remain negative, sales, gross profit, adjusted EBITDA and cash runway are more informative than P/E.
| Measure | Value |
|---|---|
| Share price | $78.48 |
| Market capitalization | $14.31B |
| Market cap / 2026 revenue guide | 8.93x (d) |
| Market cap / annualized Q3 revenue | 8.70x (d) |
| Market cap / annualized Q3 gross profit | 13.42x (d) |
| Market cap / adjusted EBITDA guide | 220x (d) |
| Cash runway at annualized nine-month burn | about 9.0 years (d) |
Investment read-through. The valuation prices Tempus as a high-growth data platform rather than a diagnostic laboratory. At 8.9x guided revenue and 220x adjusted EBITDA, the thesis depends on Data & Applications becoming a much larger share of the business. If the company eventually earned a 20% EBITDA margin on guided revenue, the current market capitalization would still equal 44.7x EBITDA (d).
What has to be true. Higher-margin data revenue must outgrow diagnostics for years, adjusted EBITDA must convert into cash and securities gains must not be mistaken for operating progress.
Source: Market quote and market capitalization from the in-session U.S. equity market feed; operating data and guidance from Tempus AI's Q3 2026 SEC exhibit. Market data: latest quote retrieved after the November 2, 2026 U.S. trading session.
Risks: What Would Break The Thesis
- GAAP quality. Unrealized gains can reverse.
- Stock compensation. Q3 expense and payroll taxes were $50.8M.
- Cash burn. Operations used $71.6M in nine months.
- Acquisition risk. The Personalis transaction remains subject to shareholder approval.
The case improves if Data & Applications sustains 30%+ growth and operating cash use declines faster than adjusted EBITDA rises.
What To Watch Next
- Data & Applications growth against 33%.
- Diagnostics revenue growth against 20%.
- Operating loss against $56.9M.
- Operating cash use after $71.6M year to date.
- Personalis shareholder vote and integration.

Sandeep Gupta
Independent equity research analyst publishing forensic theses on US-listed stocks. MBA, Politecnico di Milano School of Management (Milan, Italy).
Get new research in your inbox
Subscribe to receive forensic equity research the moment it's published. Free, no spam.
Discussion
Be the first to comment.