
Investment Thesis
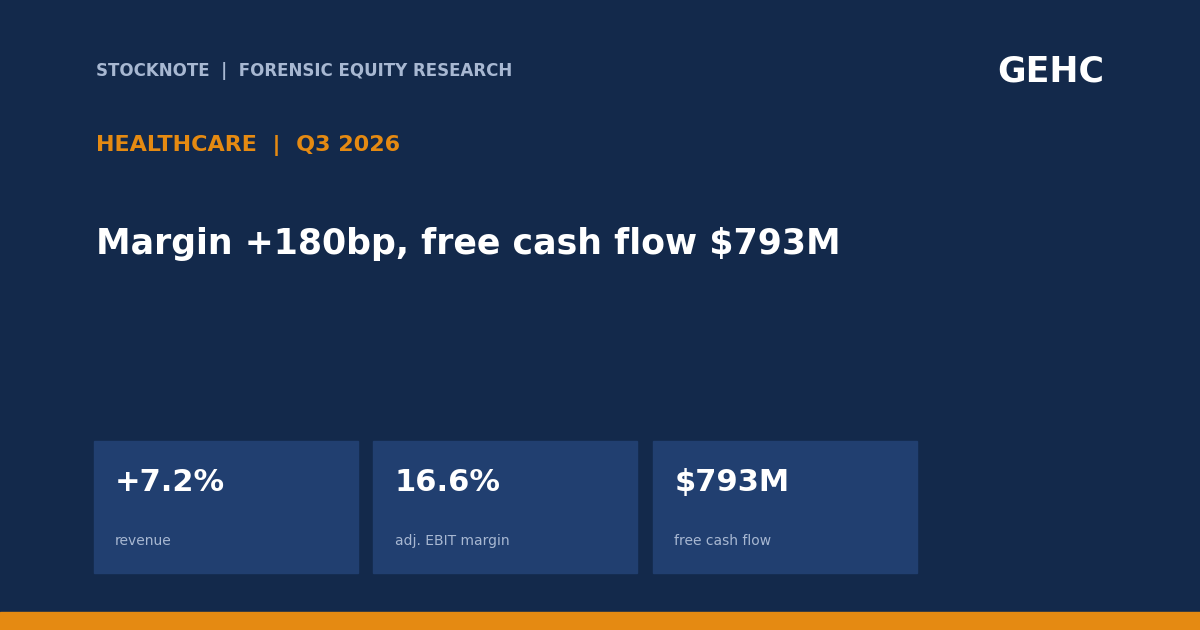
GE HealthCare grew Q3 2026 revenue 7.2% to $5,513M and organic revenue 6.2%. Adjusted EBIT margin rose 180 basis points to 16.6%, and free cash flow rose $310M to $793M. Both profit and cash benefited from a $55M tariff refund. The core improvement remains broad—every segment grew and Patient Care Solutions expanded EBIT margin 480 basis points—but the refund explains about 18% of the free-cash-flow increase (d).
- Revenue. $5,513M, +7.2%; organic +6.2%.
- Orders. Organic +4%; book-to-bill 1.03x; backlog $23.7B.
- Margins. Net income margin 11.1%; adjusted EBIT margin 16.6%.
- Cash. Operating cash flow $907M; free cash flow $793M; tariff refund $55M.
- Guidance. Adjusted EPS raised to $4.95-$5.05 and free cash flow to $1.6B+.
- This article contains no rating, price target or investment advice. Derived figures are marked (d).
Bottom line. The margin recovery is wider than the refund: adjusted EBIT increased $152M, while the refund was $55M. Still, readers should separate the one-time cash receipt from the recurring benefits of volume, price and productivity.
Source: GE HealthCare Q3 2026 earnings release (8-K exhibit).
Q3 2026 At A Glance
| Measure | Q3 2026 | Q3 2025 |
|---|---|---|
| Revenue | $5,513M | $5,143M |
| Adjusted EBIT | $913M | $761M |
| Adjusted EBIT margin | 16.6% | 14.8% |
| GAAP EPS | $1.36 | $0.98 |
| Adjusted EPS | $1.34 | $1.07 |
| Free cash flow | $793M | $483M (d) |
Source: GE HealthCare Q3 2026 earnings release (8-K exhibit). Derived figures are marked (d).
What The Market Believes vs. What The Data Actually Shows
| Belief | What the data show |
|---|---|
| The tariff refund explains the whole margin gain | It was $55M versus a $152M increase in adjusted EBIT; most improvement came from other drivers. |
| Growth is concentrated in equipment | Services grew 8.0% (d), faster than products at 6.7% (d). |
| All segments improved equally | Patient Care Solutions EBIT rose 149%, far faster than its 8.5% revenue growth. |
| Backlog guarantees acceleration | Orders grew 4%, below organic revenue growth of 6.2%; book-to-bill was only modestly above one. |
Forensic #1: Product Versus Service Growth
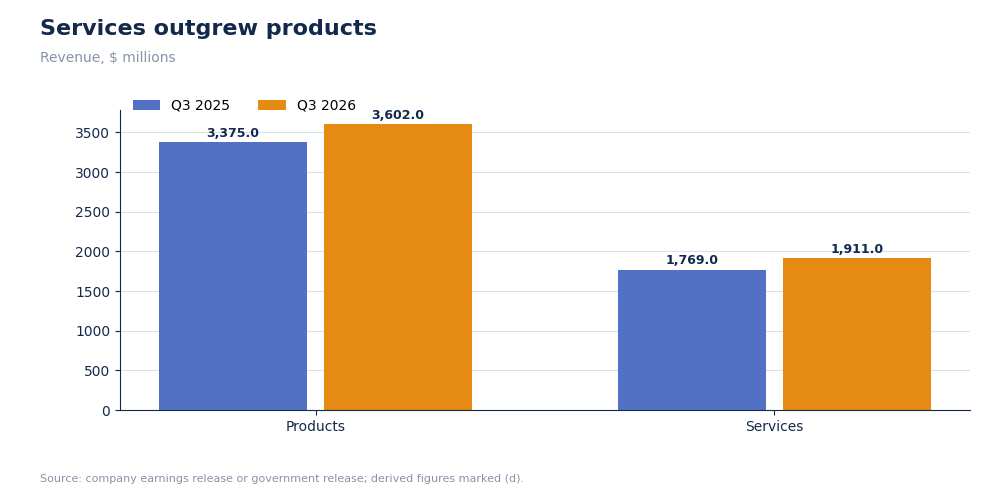
Services can carry a different margin and recurrence profile from equipment sales. Separating the two tests whether growth is only a shipment cycle.
| Revenue | Q3 2025 | Q3 2026 | Growth (d) |
|---|---|---|---|
| Products | $3,375M | $3,602M | +6.7% |
| Services | $1,769M | $1,911M | +8.0% |
| Total | $5,143M | $5,513M | +7.2% |
GE HealthCare product and service revenue growth
Services outgrew products by 1.3 points (d) and supplied 38% of the dollar revenue increase (d). That mix adds a recurring component to the quarter rather than leaving growth dependent only on equipment installations.
Why it matters. Service growth can make revenue and cash flow less cyclical.
Source: GE HealthCare Q3 2026 earnings release (8-K exhibit)
Forensic #2: Segment Margin Decomposition
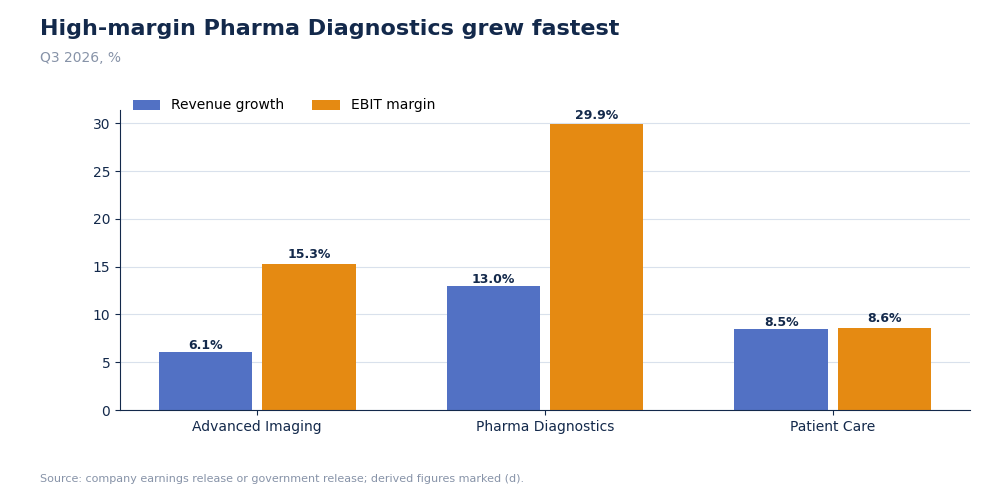
Segment margin shows whether revenue growth is becoming more or less profitable. A small segment can matter disproportionately if its rate changes sharply.
| Segment | Revenue | Growth | EBIT margin | Margin change |
|---|---|---|---|---|
| Advanced Imaging | $3,873M | +6.1% | 15.3% | +130 bp |
| Pharma Diagnostics | $846M | +13.0% | 29.9% | +50 bp |
| Patient Care Solutions | $793M | +8.5% | 8.6% | +480 bp |
GE HealthCare segment revenue growth and EBIT margin
Pharmaceutical Diagnostics remains the highest-margin business, while PCS produced the strongest margin change. The company-wide adjusted EBIT margin expanded even though the fastest revenue growth came in the already high-margin PDx segment.
Why it matters. Both mix and within-segment execution supported profit growth.
Source: GE HealthCare Q3 2026 earnings release (8-K exhibit)
Forensic #3: Cash Conversion And The Tariff Refund
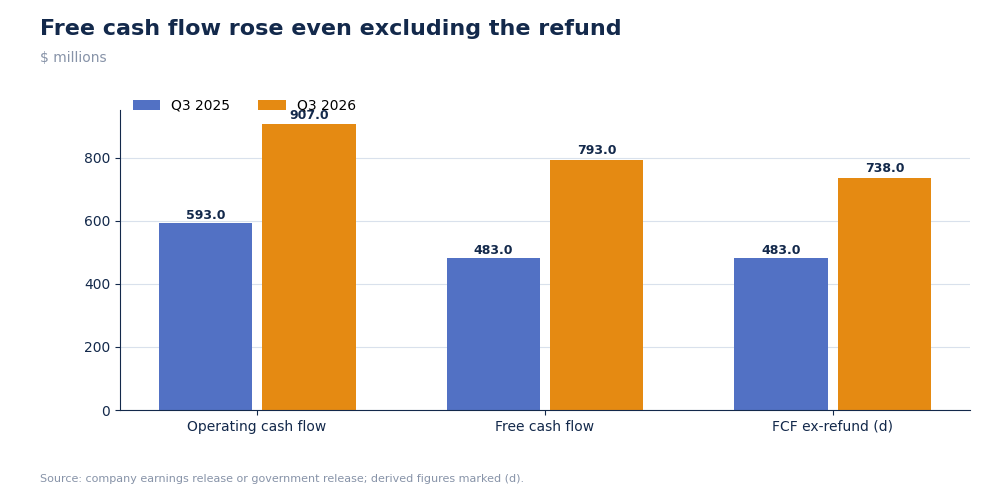
Free cash flow equals operating cash flow less capital expenditure. One-time refunds improve both current profit and cash, so they should be isolated.
| Cash item | Q3 2025 | Q3 2026 |
|---|---|---|
| Operating cash flow | $593M (d) | $907M |
| Capital expenditures | $110M | $114M |
| Free cash flow | $483M (d) | $793M |
| Tariff refund | $55M |
GE HealthCare Q3 operating and free cash flow
Free cash flow increased $310M; the $55M refund was 18% of that increase (d) and 7% of current free cash flow (d). Excluding it, free cash flow was about $738M (d), still 53% above the prior year (d).
Why it matters. The cash improvement remains substantial after removing the unusual benefit.
Source: GE HealthCare Q3 2026 earnings release (8-K exhibit)
Forensic #4: Guidance Raise And Backlog
A guidance raise is higher quality when it comes with orders and cash, not only accounting margin.
| 2026 guidance | Previous | Updated |
|---|---|---|
| Organic revenue growth | 3%-4% | about 4% |
| Adjusted EBIT margin | 15.4%-15.7% | 15.5%-15.7% |
| Adjusted EPS | $4.80-$5.00 | $4.95-$5.05 |
| Free cash flow | about $1.6B | $1.6B+ |
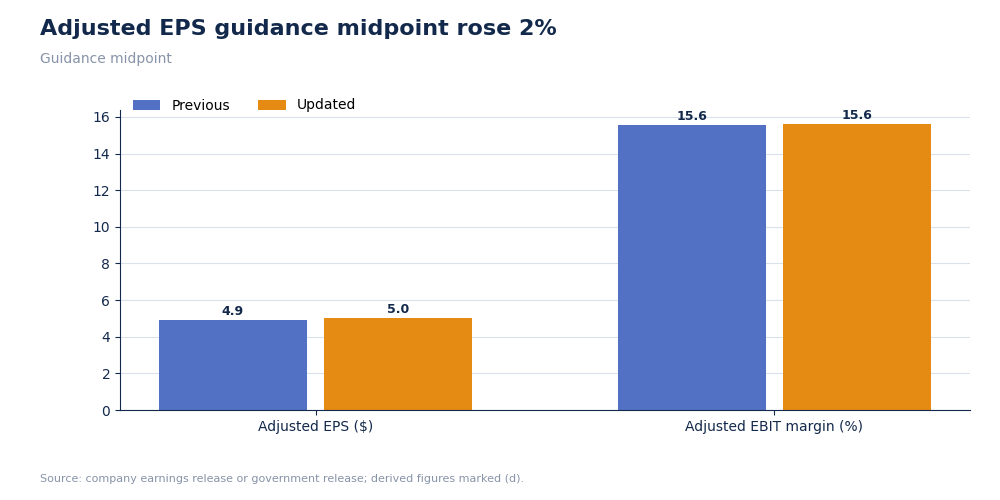
GE HealthCare midpoint guidance changes
The adjusted EPS midpoint rose from $4.90 to $5.00, or 2.0% (d), while the margin midpoint rose 5 bp (d). The raise is modest relative to the Q3 result, consistent with management retaining caution on the fourth quarter.
Why it matters. The backlog supports visibility, but orders growing below revenue keep the guide from being a pure acceleration signal.
Source: GE HealthCare Q3 2026 earnings release (8-K exhibit)
Valuation Snapshot
At $79.55 per share, GE HealthCare had a market capitalization of $36.04B. Using $10.0B of debt and $2.9B of cash, enterprise value is approximately $43.14B (d). The midpoint of adjusted 2026 EPS guidance produces a 15.9x forward P/E (d).
| Measure | Value |
|---|---|
| Share price | $79.55 |
| Market capitalization | $36.04B |
| Enterprise value | $43.14B (d) |
| Forward adjusted P/E | 15.9x (d) |
| Market cap / $1.6B FCF guide | 22.5x (d) |
| Guided FCF yield | 4.4% (d) |
| EV / annualized Q3 revenue | 1.96x (d) |
Investment read-through. The earnings multiple is moderate, but the cash-flow multiple is materially higher. That gap means investors must decide whether current working-capital and tariff effects understate sustainable cash. At a 5% FCF yield, the company would need about $1.80B of annual FCF (d), roughly 13% above the $1.6B floor.
What has to be true. Productivity and service mix must preserve margins after the tariff refund, while free cash flow grows toward the level implied by the earnings multiple.
Source: Market quote, market capitalization and trailing P/E from the in-session U.S. equity market feed; cash, debt and guidance from GE HealthCare's Q3 2026 release. Market data: latest quote retrieved after the November 2, 2026 U.S. trading session.
Risks: What Would Break The Thesis
- Refund normalization. The $55M benefit may not repeat.
- Order growth. Organic orders grew more slowly than organic revenue.
- Debt. Total debt remains $10.0B.
- Acquisition execution. The company plans a $945M cash acquisition of SOFIE.
The reading would be too cautious if Patient Care Solutions sustains its margin step and service growth remains above product growth.
What To Watch Next
- Adjusted EBIT margin against 16.6%.
- Organic orders against 4%.
- Free cash flow against the $1.6B+ guide.
- PCS EBIT margin against 8.6%.
- Debt after the SOFIE transaction.

Sandeep Gupta
Independent equity research analyst publishing forensic theses on US-listed stocks. MBA, Politecnico di Milano School of Management (Milan, Italy).
Get new research in your inbox
Subscribe to receive forensic equity research the moment it's published. Free, no spam.
Discussion
Be the first to comment.