
Investment Thesis
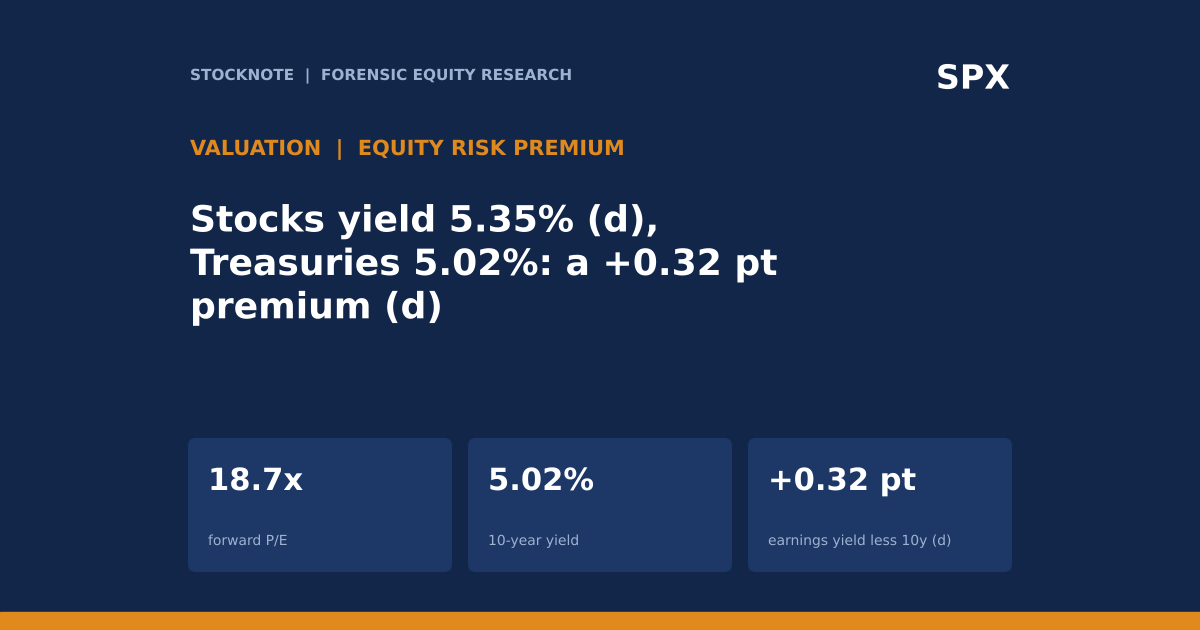
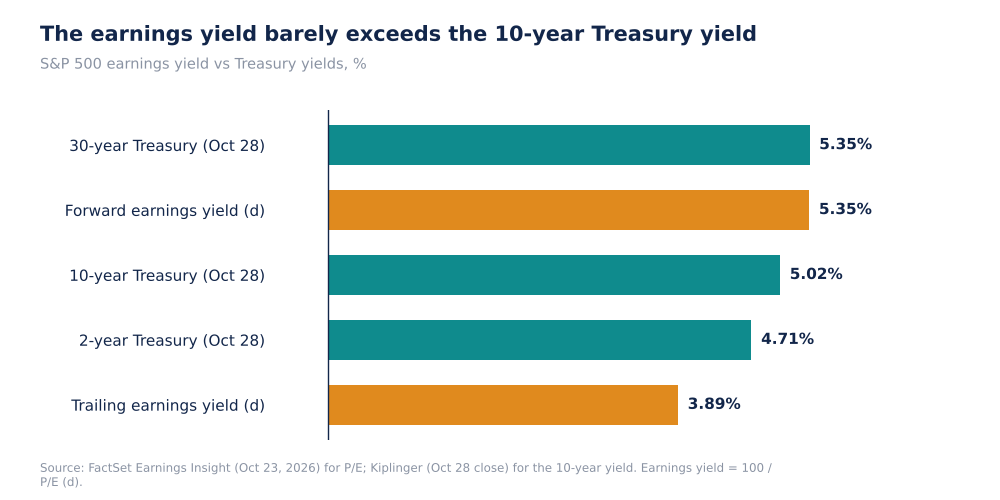
The forward P/E on the S&P 500 is 18.7, below its five-year average of 19.8, and on that basis the market looks reasonable. The 10-year Treasury yield, however, closed at 5.024% on October 28, and a bond yielding 5.02% competes directly with a forward earnings yield of 5.35% (d). The gap between them, the equity risk premium on this simple measure, is +0.32 percentage points (d). On trailing earnings (P/E 25.7) the earnings yield is 3.89% (d), which is 1.13 points below the Treasury yield (d). This article lays out what the earnings-yield-minus-bond-yield measure shows, what it leaves out, and what combinations of multiples and yields would change the conclusion.
- Forward P/E. 18.7 (five-year average 19.8, ten-year 19.1), giving a forward earnings yield of 5.35% (d). Trailing P/E 25.7, a yield of 3.89% (d).
- Treasuries. 2-year 4.706%, 10-year 5.024%, 30-year 5.351% (Oct 28, Kiplinger). The 10-year was near 5.25% around October 1 (Kaplan, via Mitrade) and was described as close to its highest since 2007.
- Premium. Forward earnings yield less the 10-year yield: +0.32 points (d). At the five-year average P/E of 19.8 it would be +0.03 points (d); at the ten-year average of 19.1 it would be +0.21 points (d).
- Breakeven. At a 5.024% yield the earnings yield equals the bond yield at a P/E of 19.9 (d), only 1.2 turns above today's 18.7.
- This article contains no rating, price target or investment advice. Every figure comes from a named source and anything I calculated is marked (d).
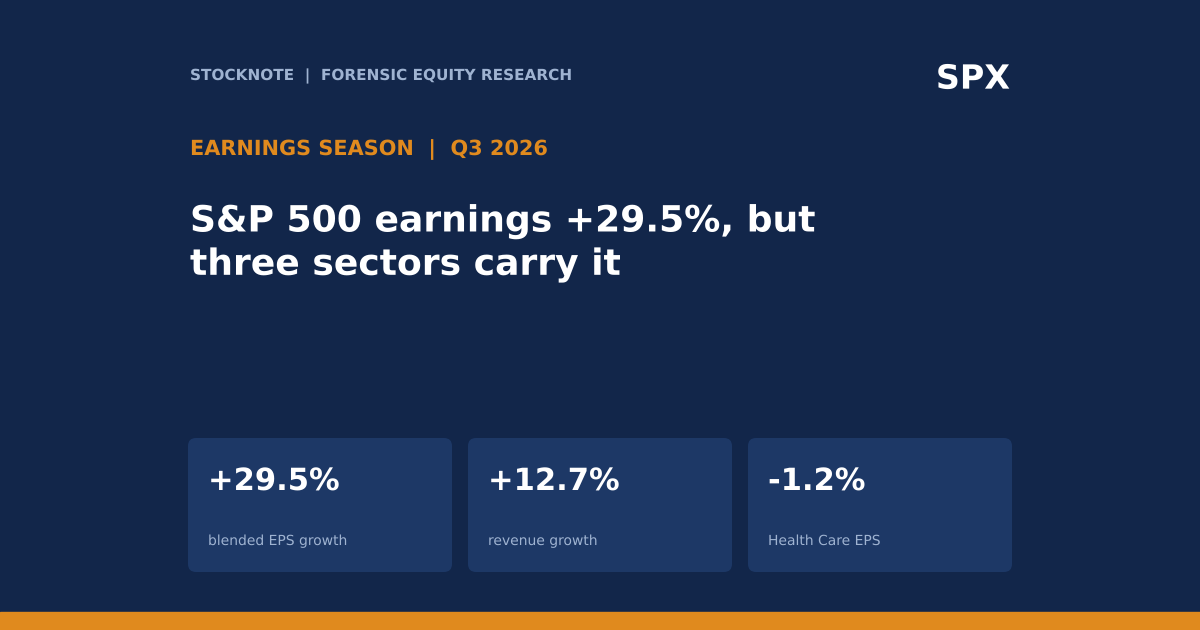
Bottom line. Whether the market is cheap depends on the yardstick. Against its own history, with a forward P/E under its averages, it is. Against the bond market, the premium for owning equities on current earnings is close to zero. The two are consistent: multiples have not risen, but bond yields have. What equities offer beyond a Treasury is growth, and the forward estimates (CY2027 EPS growth of 16.0%) have to deliver it.
Sources: FactSet Earnings Insight, Oct 23, 2026; Kiplinger, Oct 28 closing yields. P/E data are from Oct 23 and yields from Oct 28; the two dates do not match.
Valuation At A Glance
| Measure | Figure | Calculation |
|---|---|---|
| Forward 12-month P/E | 18.7 | FactSet |
| Forward earnings yield (d) | 5.35% | 100 / 18.7 |
| Trailing P/E | 25.7 | FactSet |
| Trailing earnings yield (d) | 3.89% | 100 / 25.7 |
| 10-year Treasury yield | 5.024% | Kiplinger, Oct 28 |
| Forward premium (d) | +0.32 points | 5.35 - 5.02 |
| Trailing premium (d) | -1.13 points | 3.89 - 5.02 |
| Breakeven forward P/E at 5.024% (d) | 19.9 | 100 / 5.024 |
Sources: FactSet; Kiplinger. Calculated rows (d) are mine.
What The Market Believes vs. What The Data Actually Shows
| Belief | What the data show |
|---|---|
| The market is cheap because the P/E is below average | The forward P/E of 18.7 is below the 19.8 five-year average, but each turn of P/E is worth about 0.3 points of earnings yield (d), and the 10-year yield is more than 1 point higher than a year earlier, according to the Kaplan article. |
| Earnings growth makes equities better than bonds | True only if the growth arrives. FactSet's estimates are +33.1% in 2026 and +16.0% in 2027; the premium on current earnings is +0.32 points (d). |
| High yields are bad for stocks | Not mechanically. The effect depends on the multiple, and the table below shows that a 5.5% yield with an 18.7 multiple gives a negative premium (d). |
| The trailing P/E of 25.7 is the right number | It is the more conservative one, and against it the earnings yield is below the bond yield by 1.13 points (d); the forward figure assumes estimates hold. |
The trailing and forward measures differ by 7.0 turns of P/E (d), which is a one-year expected earnings growth of about 37% (25.7 / 18.7 = 1.37, d). The forward premium therefore embeds the market's expectation of 37% growth, and removing it turns the premium negative.
Forensic #1: Earnings Yield Against Bond Yields
Earnings Yield Vs Treasury Yields, % (Self-Made)
The forward earnings yield (5.35%) sits level with the 30-year Treasury (5.351%) and 0.32 points above the 10-year (d). Equities are long-duration claims on a growing stream of profits, so the 30-year Treasury is as relevant a comparison as the 10-year; against it the premium is zero (d). A bond's 5.02% is a promise in nominal terms. An earnings yield of 5.35% is a share of profits that are expected to grow, and also can fall.
Why it matters. The comparison hides two differences, both of which investors should price. Equity earnings carry risk and could decline in a recession, so some premium is needed. Equity earnings also grow with nominal output, which a fixed coupon does not. A premium near zero on forward earnings means the market is paying fully for the growth.
Sources: FactSet; Kiplinger. Earnings yields are my arithmetic (d).
Forensic #2: Sensitivity To The Multiple And The Yield
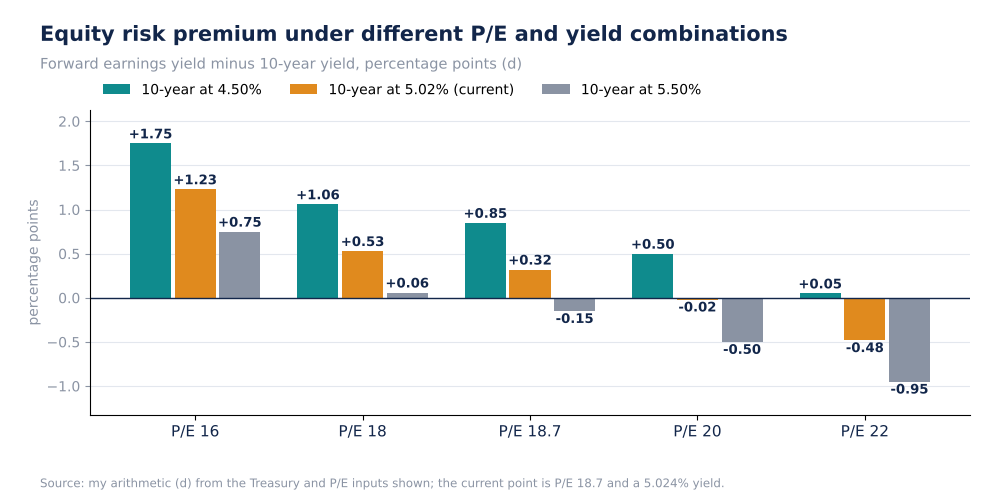
| Forward P/E | 10-year at 4.50% | 10-year at 5.024% (current) | 10-year at 5.50% |
|---|---|---|---|
| 16 | +1.75 | +1.23 | +0.75 |
| 18 | +1.06 | +0.53 | +0.06 |
| 18.7 | +0.85 | +0.32 | -0.15 |
| 20 | +0.50 | -0.02 | -0.50 |
| 22 | +0.05 | -0.48 | -0.95 |
Premium (Earnings Yield Less 10-Year Yield), Percentage Points (Self-Made, d)
The table shows that the premium is more sensitive to the yield than to a one-turn move in the P/E. At the current P/E of 18.7, a rise in the 10-year yield from 5.024% to 5.50% turns the premium from +0.32 to -0.15 (d). At the current yield, a fall of the multiple to 16 raises the premium to +1.23 (d), and a rise to 22 reduces it to -0.48 (d). To keep the premium at today's +0.32 points, a 48 basis point rise in yields (5.024% to 5.50%) would need the P/E to fall from 18.7 to about 17.2, or 1.5 turns (d).
Why it matters. The index can fall because yields rise even when earnings do not change. That is the mechanism behind the Fed-and-term-premium article in this series: the 10-year yield moved from about 5.25% around October 1 to 5.024% on October 28 (Kaplan; Kiplinger), roughly 23 basis points (d), or about 0.8 turns of P/E at a constant premium (d).
Source: my arithmetic (d), using FactSet and Kiplinger inputs. Not a forecast.
Forensic #3: The Breakeven Yield
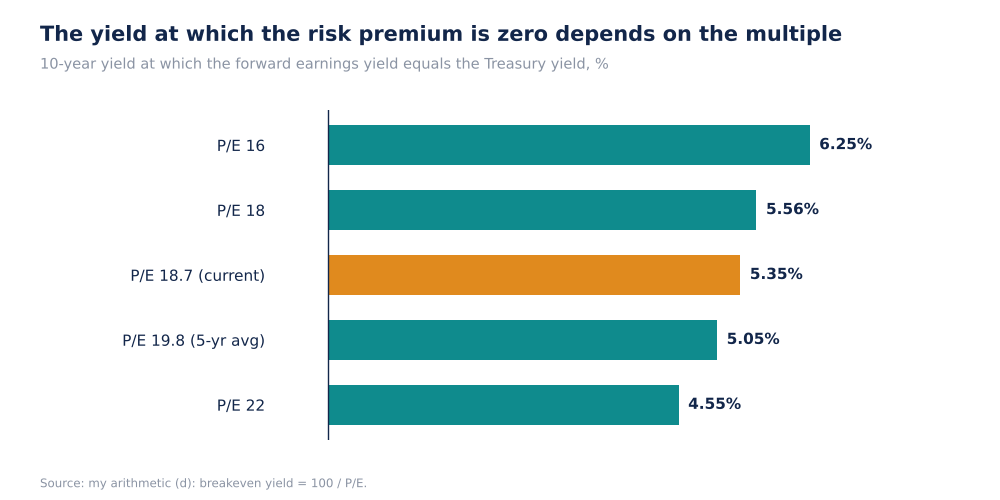
| Forward P/E | Earnings yield (d) | Breakeven 10-year yield (d) |
|---|---|---|
| 16.0 | 6.25% | 6.25% |
| 18.0 | 5.56% | 5.56% |
| 18.7 (current) | 5.35% | 5.35% |
| 19.8 (5-year average) | 5.05% | 5.05% |
| 22.0 | 4.55% | 4.55% |
Yield At Which Earnings Yield Equals The 10-Year, % (Self-Made)
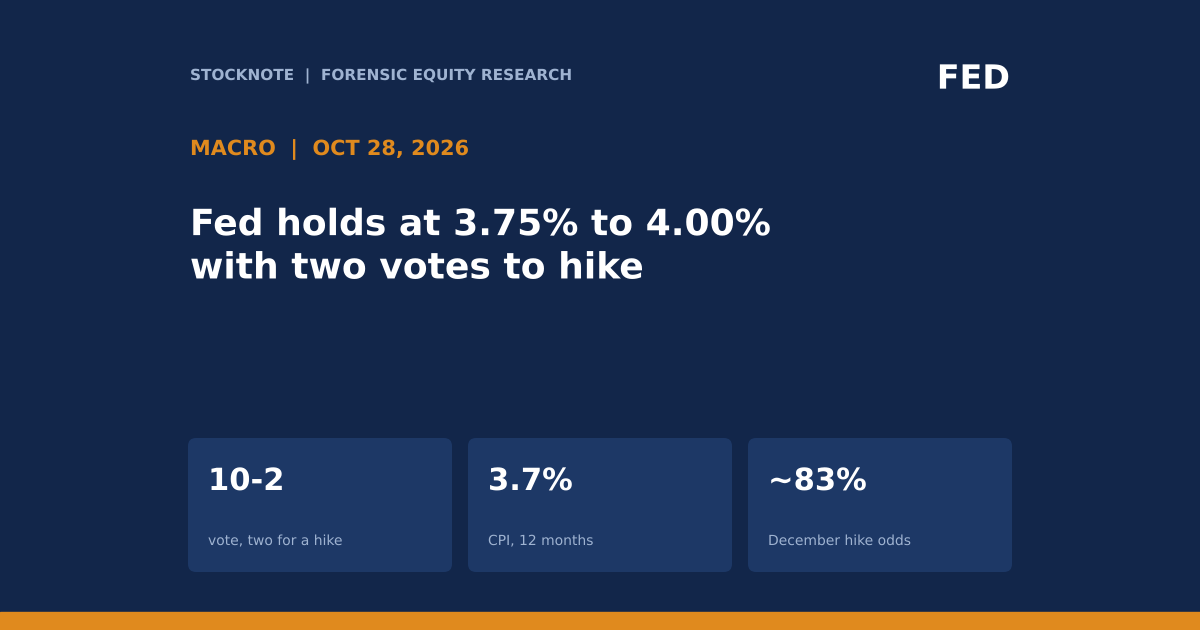
The breakeven yield is simply the earnings yield, and the useful reading is the distance from the current yield: 5.35% less 5.024% is 33 basis points (d). If the 10-year rises by more than that without a fall in the multiple, the forward earnings yield is below the bond yield. In that sense the market has less cushion than the headline P/E suggests. In 2026 the Fed has raised once (September) and the market sees a December hike as more likely than not (82.6% to about 85%), so the yield path is itself uncertain.
Why it matters. A buffer of 33 basis points is small relative to the movement in the 10-year yield within a single month (the 23 basis points between early October and October 28, d). Investors who use the P/E-below-average argument need an explicit view on where yields go.
Sources: Kiplinger; FactSet. Breakevens are my arithmetic (d).
Forensic #4: What The Premium Leaves Out
| Factor | Direction | Evidence in this article |
|---|---|---|
| Earnings growth | Raises equity return | CY2026 +33.1%, CY2027 +16.0% (FactSet estimates) |
| Margin reversion | Lowers it | Net margin 14.9% (Q3) and 17.0% (Q2) vs a 12.6% five-year average |
| Inflation compensation | Is in the bond yield | CPI 3.7% y/y; the 10-year yield less CPI is +1.3 points (d) |
| Earnings quality | Uncertain | Surprise only +2.1% vs +7.5% average |
| Concentration | Raises risk | Energy +136.0% and IT +65.6% carry the growth |
A fixed coupon of 5.02% is eroded by inflation of 3.7%, so the 10-year real yield on that basis is about 1.3 points (d), a rough measure because it uses past inflation. Equity earnings are partly a claim on nominal output. If the long-run growth in earnings per share were, as an illustration, 3% to 5% a year, then the earnings yield plus growth would be about 8.3% to 10.3% (d) against the Treasury's 5.02%. These growth rates are my assumptions, not data, and are shown only to indicate that the zero premium on the simple measure is not the same as zero expected excess return.
Why it matters. The simple measure answers a narrow question: how much more earnings yield do equities offer than bonds today. It says nothing about the growth that investors are paid for owning, nor about the risk that the earnings fall. Investors should hold both pieces of information: a small premium on current earnings and a large reliance on growth.
Sources: FactSet; Kiplinger; Stocknote's September CPI article. The growth range is an illustrative assumption.
Valuation Snapshot
| Measure | Figure |
|---|---|
| S&P 500 (FactSet date close) | 7,663.43 |
| S&P 500 (Oct 28 close, Kiplinger) | 7,743 |
| Forward P/E / trailing P/E | 18.7 / 25.7 |
| Forward earnings yield / trailing (d) | 5.35% / 3.89% |
| 10-year yield | 5.024% |
| Premium forward / trailing (d) | +0.32 / -1.13 points |
What has to be true. For the index to hold its multiple at a 5.0% to 5.5% yield, forward earnings need to be delivered (CY2027 +16.0%), margins need to stay near the current 14.9% or higher, and yields must not rise by much more than the 33 basis point buffer (d). If any one fails, the premium goes negative or the multiple has to fall.
Risks: What Would Break The Thesis
- Yields. The buffer is 33 basis points (d); the 10-year moved 23 basis points in under a month.
- Earnings. The forward earnings yield rests on estimates; a 10% cut lowers the yield to 4.8% (d), below the bond yield.
- Timing. P/E data are from October 23 and yields from October 28.
- Method. The measure compares a nominal bond yield with an earnings yield; it omits growth, risk and payout.
- Rounding. The P/E is quoted to one decimal; a 0.1 error changes the earnings yield by 0.03 points (d).
The conclusion could be wrong in either direction: a falling yield would restore a cushion, and growth that exceeds estimates would raise the earnings yield on trailing numbers.
What To Watch Next
- The 10-year yield against the 5.35% earnings yield level.
- Updated FactSet forward P/E as the earnings season completes.
- The December FOMC decision, priced at 82.6% to about 85%.
- Forward EPS revisions: a 10% cut in forward earnings would reduce the earnings yield to 4.8% (d).
- Net margin against the 17.0% record and the 12.6% average.

Sandeep Gupta
Independent equity research analyst publishing forensic theses on US-listed stocks. MBA, Politecnico di Milano School of Management (Milan, Italy).
Get new research in your inbox
Subscribe to receive forensic equity research the moment it's published. Free, no spam.
Discussion
Be the first to comment.