
Investment Thesis
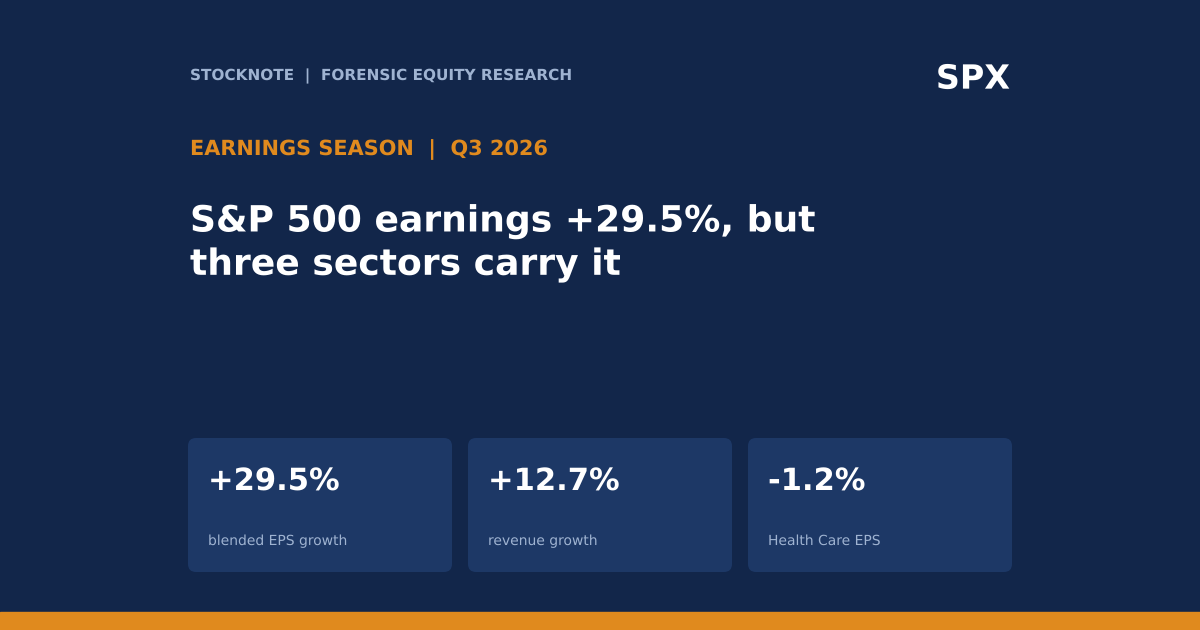
FactSet's blended estimate puts S&P 500 earnings per share for the third quarter of 2026 up 29.5% from a year earlier on revenue growth of 12.7%. That is a third straight quarter above 25% and, if it holds, an eighth straight quarter of double-digit growth. The headline is strong, but earnings growth is 2.3 times revenue growth (d) and the sector detail shows that it is uneven: Energy is up 136.0%, Information Technology 65.6%, and Health Care is the only sector falling (-1.2%). This article explains how to read an earnings-season aggregate, which parts of 29.5% are broad and which are narrow, and what the forward estimates imply.
- Growth. Blended EPS +29.5% (29.2% on September 30); revenue +12.7% (12.2% on September 30). Ten of eleven sectors are growing earnings and all eleven are growing revenue.
- Beats. 83% of reporting companies beat EPS estimates (five-year average 78%), but the aggregate surprise is only +2.1% against a five-year average of +7.5%. 66% beat on revenue, below the five-year average of 70%.
- Margin. Net profit margin 14.9% against 13.0% a year ago and a five-year average of 12.6%. The prior quarter, at 17.0%, was a record in FactSet's data.
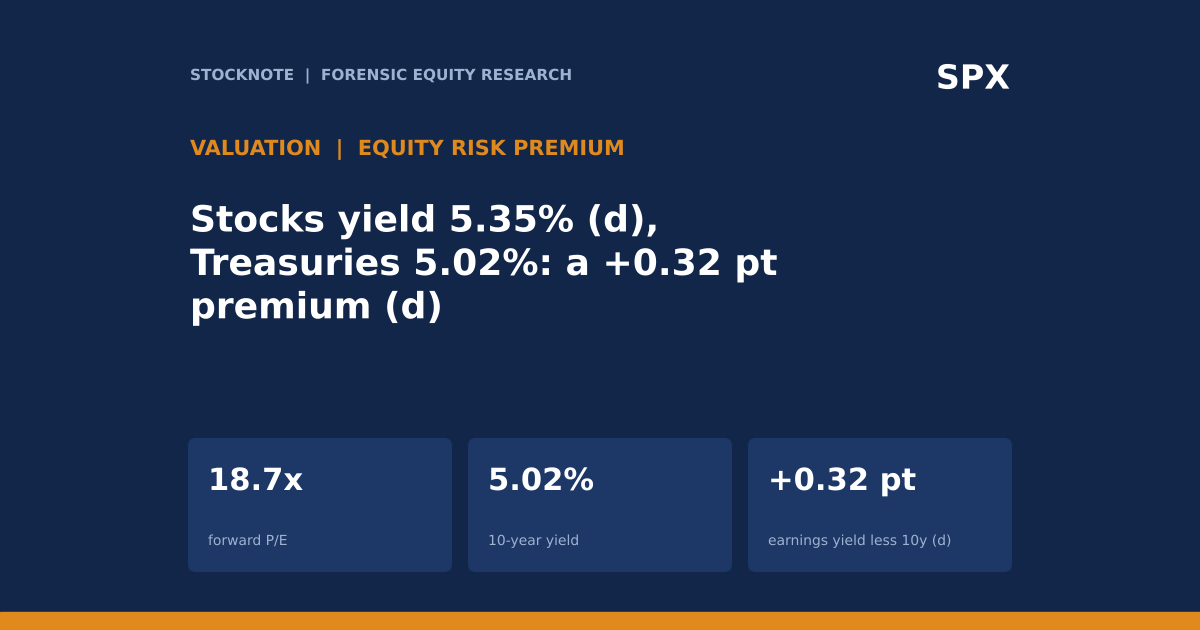
- Valuation. Forward 12-month P/E 18.7 (five-year average 19.8, ten-year 19.1); trailing 25.7.
- Outlook. Estimated growth: Q4 2026 +29.2%, calendar 2026 +33.1%, calendar 2027 +16.0%.
- This article contains no rating, price target or investment advice. Every figure comes from a named source and anything I calculated is marked (d).
Bottom line. The aggregate says earnings are booming; the distribution says the boom is concentrated in energy, semiconductors and a few large technology names, while Health Care is shrinking and the typical company is beating a lowered bar by a small amount. Only about 24% of companies had reported when these figures were published, so every number here will move. The useful reading is structural: how much of the growth would remain if the largest contributors were removed, and how much of the expected 2027 slowdown is already in the numbers.
Sources: FactSet Insight, Oct 23, 2026; FactSet Earnings Insight, Oct 23, 2026.
Q3 2026 At A Glance
| Metric | Q3 2026 (blended) | Reference |
|---|---|---|
| EPS growth | 29.5% | 29.2% on Sept 30 |
| Revenue growth | 12.7% | 12.2% on Sept 30 |
| % beating EPS | 83% | 5-yr 78%, 10-yr 77% |
| % beating revenue | 66% | 5-yr 70%, 10-yr 68% |
| EPS surprise | +2.1% | 5-yr +7.5%, 10-yr +8.0% |
| Revenue surprise | +1.2% | 5-yr +1.8%, 10-yr +1.6% |
| Net profit margin | 14.9% | Q2 2026 17.0%; Q3 2025 13.0%; 5-yr 12.6% |
| Forward 12-month P/E | 18.7 | 5-yr 19.8; 10-yr 19.1 |
| Negative Q4 EPS guidance | 7 of 17 (41%) | 5-yr average 60% |
Source: FactSet Earnings Insight, Oct 23, 2026. About 24% of companies had reported.
What The Market Believes vs. What The Data Actually Shows
| Belief | What the data show |
|---|---|
| Earnings are growing across the market | Ten of eleven sectors grew, but five are in double digits and the leaders (Energy 136.0%, IT 65.6%) are far above the 29.5% average. Financials grew 4.6% and Health Care fell 1.2%. |
| A record number of companies are beating | 83% beat on EPS, above average, but the average surprise (+2.1%) is less than a third of the five-year norm (+7.5%). More beats of smaller size is what a lower bar looks like, and I cannot tell from the data whether estimates were cut or companies guided carefully. |
| Margins are at all-time highs | The Q2 margin of 17.0% was a record in FactSet's data; the Q3 figure of 14.9% is still the second highest since 2009 if it holds, but it is below Q2 and based on 24% of reports. |
| Stocks are expensive | The forward P/E of 18.7 is below the five-year (19.8) and ten-year (19.1) averages; the trailing P/E of 25.7 is 7.0 turns higher (d), because the next twelve months are expected to grow faster than the last twelve. |
| Growth continues at this pace | Analysts estimate 16.0% for calendar 2027 against 33.1% for 2026, roughly half the rate. |
The first row of the table above is the key to reading the season. A blended growth rate is a weighted average, and an average of 29.5% with one sector at 136.0% and one at -1.2% tells you less than the spread does.
Forensic #1: The Sector Distribution
| Sector | Q3 2026 EPS growth | Gap to S&P 500 (d) |
|---|---|---|
| Energy | +136.0% | +106.5 pts |
| Information Technology | +65.6% | +36.1 pts |
| Communication Services | +39.8% | +10.3 pts |
| Materials | +30.0% | +0.5 pts |
| Industrials | +17.6% | -11.9 pts |
| Financials | +4.6% | -24.9 pts |
| Health Care | -1.2% | -30.7 pts |
| S&P 500 | +29.5% | n/a |
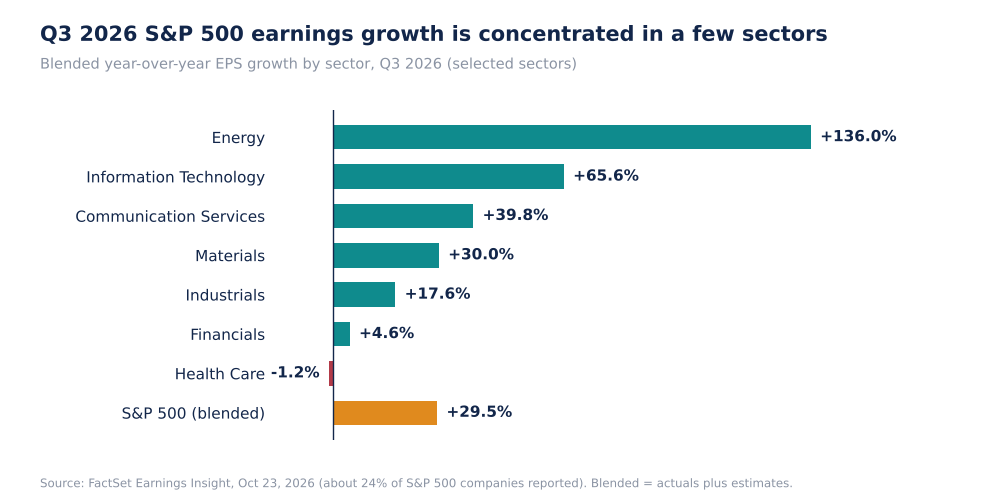
Q3 2026 Blended EPS Growth By Sector (Self-Made, FactSet Data)
Three of the seven listed sectors (Industrials, Financials and Health Care) are below the index average of 29.5%, and FactSet's text gives no figures for the other four sectors, so I cannot show all eleven. Within the leaders FactSet says Semiconductors and Semiconductor Equipment grew 131% and was the largest contributor to Information Technology, and that Energy was the largest contributor to the increase in the index growth rate since September 30 (upward EPS revisions). Valero was the largest positive EPS surprise ($23.90 against $21.17). On the other side, the Pharmaceuticals industry (-17%) drove the Health Care decline, and Meta had the largest negative surprise ($3.83 against $6.54), caused by a $9.89B litigation charge.
Why it matters. This is a rotation story as much as a growth story. A 131% rise in semiconductor earnings is a cyclical and capital-spending signal, consistent with the data center spending discussed in Stocknote's articles on Texas Instruments, Amazon and Alphabet (FactSet does not name the cause), while the energy gain coincides with oil near $100 (the Fed article on this site cites WTI near $99.99 and Brent near $109.46). Both are driven by a price or a spending cycle and not by broad demand, which is why the margin and revenue figures matter next.
Source: FactSet Earnings Insight, Oct 23, 2026. Gaps are my arithmetic (d).
Forensic #2: Beat Rate Versus Surprise Size
| Measure | Q3 2026 | 5-year average | 10-year average |
|---|---|---|---|
| EPS beat % | 83% | 78% | 77% |
| Revenue beat % | 66% | 70% | 68% |
| EPS surprise | +2.1% | +7.5% | +8.0% |
| Revenue surprise | +1.2% | +1.8% | +1.6% |
| EPS surprise as share of 5-yr average (d) | 28% | 100% | n/a |
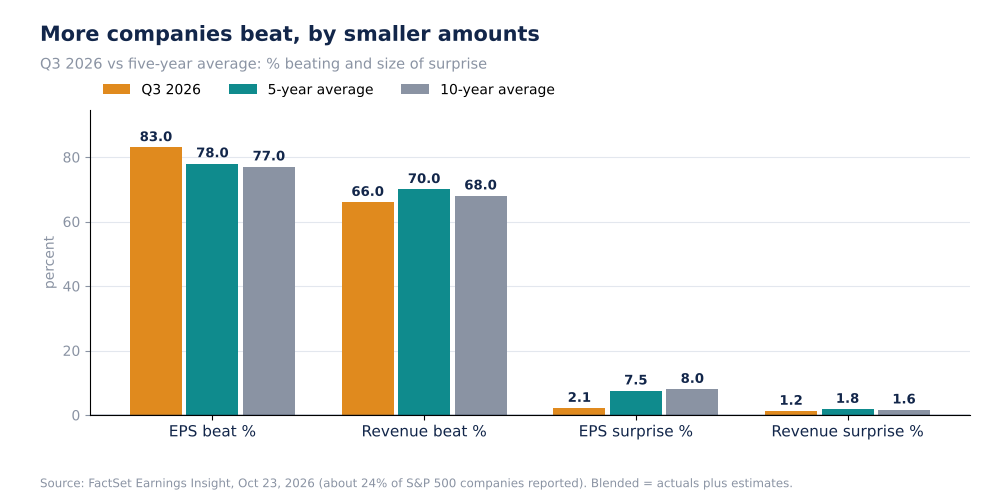
Beat Rates And Surprise Size, Q3 2026 Vs Averages (Self-Made)
The beat rate counts how many companies cleared the estimate, and the surprise is the size of the clearance in aggregate. The 2.1% surprise is 28% of the five-year average (d). Revenue shows the opposite pattern: fewer companies beat (66%) and the aggregate surprise is 1.2%. Taken together, a larger share of companies is meeting a bar set low enough to beat, but not by much. The blended growth rate has moved only from 29.2% (both on September 30 and a week earlier) to 29.5%, so the surprises are adding little to the headline.
Why it matters. When the surprise is small, the growth rate is mostly determined by what analysts already expected, so the season is a test of existing expectations and not a source of new information. The practical use is to look at individual reports against guidance and implied outlooks, as the earlier company articles do, rather than at the headline beat rate.
Source: FactSet Earnings Insight, Oct 23, 2026. The share is my arithmetic (d).
Forensic #3: Earnings Are Growing Faster Than Sales
| Measure | Value |
|---|---|
| Blended EPS growth | 29.5% |
| Blended revenue growth | 12.7% |
| Difference (d) | 16.8 points |
| EPS growth divided by revenue growth (d) | 2.3x |
| Net profit margin Q3 2026 / year ago | 14.9% / 13.0% |
| Margin change year over year (d) | +1.9 points |
| Q2 2026 margin (record in FactSet series) | 17.0% |
| 5-year average margin | 12.6% |
If profit margins rose by 1.9 points, from 13.0% to 14.9% (d), then a 12.7% increase in sales produces roughly (14.9/13.0) × 1.127 = 1.29, which is a 29% gain in net income (d), matching the 29.5% EPS figure. In other words, about 12.7 points of the growth are volume and price, and about 16.8 points (d) come from higher margins, with the remainder arising from share count and rounding. This calculation is an approximation because net income and EPS differ, but it shows that more than half of the earnings growth is margin expansion and not sales.
Why it matters. Margin gains cannot continue indefinitely: they are 2.3 points above the five-year average (d), and the Q2 figure of 17.0% was higher than Q3's. Estimates for calendar 2027 (+16.0%) are more consistent with growth that returns closer to revenue growth plus modest margin gains. The risk for investors is that an index priced on 2026 margins is exposed if margins revert, particularly in the sectors where the margin gain comes from commodity prices or capital-spending cycles.
Source: FactSet Earnings Insight, Oct 23, 2026. The decomposition is my arithmetic (d), not FactSet's.
Forensic #4: What The Forward Estimates Imply
| Period | Estimated EPS growth |
|---|---|
| Q3 2026 (blended) | 29.5% |
| Q4 2026 | 29.2% |
| Calendar 2026 | 33.1% |
| Calendar 2027 | 16.0% |
| Two-year compound, 2026 then 2027 (d) | about 54.4% |
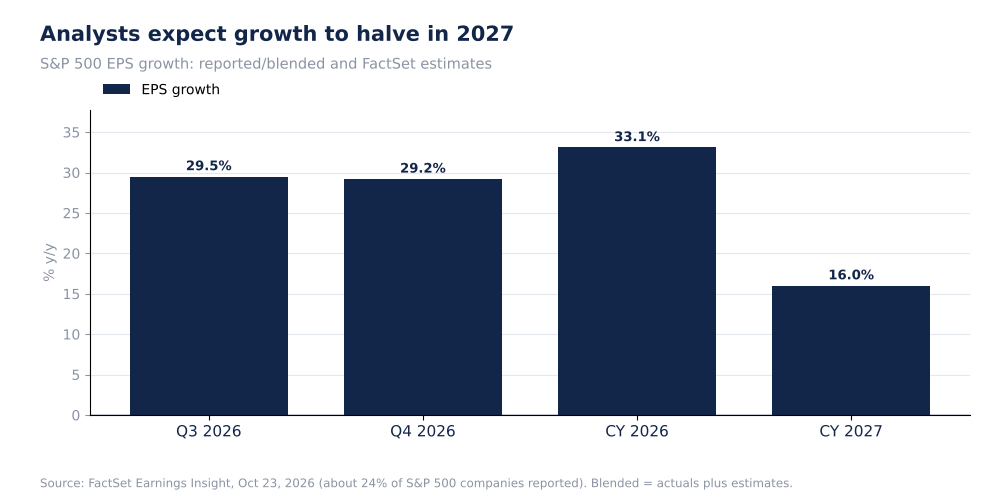
S&P 500 EPS Growth, Actual And Estimated, % (Self-Made, FactSet Data)
The compound figure is 1.331 × 1.160 = 1.544, or 54.4% (d). The index closed at 7,663.43 on the data date and FactSet's forward P/E is 18.7, which implies forward 12-month EPS of about $410 (d). FactSet's bottom-up target price is 9,314.37, 21.5% above the close; against that forward EPS it equals about 22.7 times earnings (d), higher than any average in the table above. The target is therefore consistent with analysts expecting either rising EPS over the target horizon or a higher multiple, or both. FactSet does not say which. Guidance is more balanced than usual: 7 of 17 companies (41%) issued negative Q4 EPS guidance against a five-year average of 60%, and 93 of 268 (35%) issued negative guidance for the current fiscal year.
Why it matters. A forward P/E below its averages is usually read as cheap. But a 2026 growth rate of 33.1% flatters the base, and 2027 growth of 16.0% from a higher margin base requires sales growth or further margin gains. The next article in this series puts the P/E against the 10-year Treasury yield, which is the other half of the valuation question.
Source: FactSet Earnings Insight, Oct 23, 2026. Implied EPS, the target multiple and the compound figure are my arithmetic (d); the implied EPS inherits rounding in the 18.7 P/E.
Valuation Snapshot
| Measure | Figure |
|---|---|
| S&P 500 close (FactSet data date) | 7,663.43 |
| Forward 12-month P/E | 18.7 (5-yr 19.8, 10-yr 19.1) |
| Trailing 12-month P/E | 25.7 |
| Implied forward 12-month EPS (d) | about $410 |
| FactSet bottom-up target | 9,314.37 (+21.5%) |
| Target divided by implied forward EPS (d) | about 22.7x |
What has to be true. For the index to be fairly valued at 18.7 times forward earnings, 2027 growth of 16.0% has to materialise with margins that hold close to current levels, energy and semiconductor earnings have to stay near their current run rate, and the small surprises seen so far have to avoid turning into misses.
Risks: What Would Break The Thesis
- Partial data. Only 24% of companies had reported; the blended rate will change as 179 companies were scheduled to report the following week and the rest follow.
- Concentration. Energy and semiconductors supply much of the growth, both sensitive to prices and capital spending.
- Margins. The record 17.0% in Q2 and 14.9% in Q3 sit above the 12.6% average.
- Health Care. The only sector with falling earnings; Pharmaceuticals -17%.
- Estimate quality. Small surprises mean results are close to estimates, and low surprises can precede downgrades if guidance weakens.
- Data limits. FactSet's text did not give figures for all sectors, and I derived the implied EPS from a rounded P/E.
The bull case is broad: 10 of 11 sectors growing, all 11 growing revenue and fewer negative guidance. The bear case is narrow: growth is concentrated, margins are elevated and the multiple is not low against yields.
What To Watch Next
- The following FactSet updates, as the share reporting rises from 24% toward 90%.
- Whether blended growth stays near 29% when the remaining 76% of companies report.
- Q4 guidance: negative guidance at 41% against a 60% average.
- Energy revisions, which supplied much of the increase in growth since September 30.
- Semiconductor earnings after +131%.
- Profit margin against the 17.0% record.

Sandeep Gupta
Independent equity research analyst publishing forensic theses on US-listed stocks. MBA, Politecnico di Milano School of Management (Milan, Italy).
Get new research in your inbox
Subscribe to receive forensic equity research the moment it's published. Free, no spam.
Discussion
Be the first to comment.