
Investment Thesis
The Bureau of Economic Analysis estimates that real GDP grew at a 3.4% annual rate in the third quarter of 2026, up from 2.2% in the second quarter, and that real final sales to private domestic purchasers grew 4.9%. The same month's jobs report shows nonfarm payrolls up only 29,000 in September, with the prior two months revised down by 60,000, and average hourly earnings up 3.0% over twelve months against CPI inflation of 3.7%. Output is growing quickly and hiring and real pay are not. This article sets out where the growth came from, what is missing from the data, and why the gap matters for earnings and for the Fed.
- GDP. Real GDP +3.4% annualised (a 0.8% quarterly rate), against +2.2% in Q2. Nominal GDP +5.6% annualised.
- Investment. Nonresidential fixed investment +12.7%, equipment +20.9% (led by information processing equipment, mainly computers and peripheral equipment), intellectual property products +8.8%. Residential investment -3.3%.
- Consumers and government. Consumer spending +3.8% (services led by health care, goods by prescription drugs). Government spending +5.3%, mostly federal nondefense, reflecting smaller Strategic Petroleum Reserve sales than in Q2.
- Trade. Exports decreased, led by petroleum and related products. Imports increased, with capital goods (except automotive) the largest contributor. Net exports were a drag on growth.
- Prices. PCE price index +2.1% annualised (Q2: 5.0%), core PCE +2.5% (Q2: 3.3%).
- Jobs. September payrolls +29,000 against a 12-month average of 45,000. Unemployment 4.2% (4.1% in August). Participation 61.8%. Average hourly earnings $37.81, +0.1% on the month and +3.0% on the year.
- Fed. The statement calls activity strong and says job gains have kept pace with the workforce. The target range is 3.75% to 4.00%.
- This article contains no rating, price target or investment advice. Every figure comes from a named source, and anything I calculated is marked (d).
Bottom line. Growth is strong and narrow. The release credits investment led by computer equipment and inventories, with housing and exports falling, and the labor market shows almost no net hiring. Real wages are falling by about 0.7 points (d), which makes the 3.8% rise in consumer spending harder to explain from income, and the extract I read does not include the saving rate. Investors are looking at a capital-spending boom and a stretched household, and the data do not yet show whether the first can carry the second.
Sources: BEA, GDP advance estimate for Q3 2026; NAHB Eye on Housing; BLS Employment Situation, September 2026; BLS CPI, September 2026.
Q3 2026 At A Glance
| Indicator | Latest | Prior |
|---|---|---|
| Real GDP growth, annualised | 3.4% | 2.2% (Q2) |
| Real final sales to private domestic purchasers | 4.9% | 4.6% (Q2) |
| Equipment investment | +20.9% | n/a |
| Residential investment | -3.3% | n/a |
| Consumer spending | +3.8% | n/a |
| Nonfarm payrolls, September | +29,000 | 12-month average +45,000 |
| Unemployment rate | 4.2% | 4.1% (August) |
| Average hourly earnings, 12 months | +3.0% | CPI +3.7% |
| PCE price index / core PCE, annualised | 2.1% / 2.5% | 5.0% / 3.3% (Q2) |
Sources: BEA; NAHB; BLS; BLS CPI. Q2 component growth rates were not given in the extract.
What The Market Believes vs. What The Data Actually Shows
| Belief | What the data show |
|---|---|
| The economy is strong across the board | Equipment grew 20.9% and nonresidential investment 12.7%, but residential investment fell 3.3% (single-family -5.0%) and exports fell. |
| Strong GDP means strong hiring | Payrolls rose 29,000, below the 12-month average of 45,000, and July and August were revised down by a combined 60,000. |
| Consumers are carrying growth | Consumer spending rose 3.8%, while real hourly earnings fell about 0.7 points (d) over twelve months. |
| Government spending is adding growth | It rose 5.3%, partly because Strategic Petroleum Reserve sales were smaller than in Q2, an accounting effect more than new demand. |
| Inflation is easing | Quarterly PCE fell to 2.1% from 5.0%, but September CPI was 0.6% for the month and 3.7% for the year. |
The headline reading is a robust expansion. The details show an investment-led quarter in which the labor market, housing and trade are not participating, and in which two of the supports, inventories and the government's oil reserve sales, are timing effects.
Forensic #1: Equipment And Computers Drove The Quarter
| Component (annualised real growth) | Q3 2026 |
|---|---|
| Equipment | +20.9% |
| Nonresidential fixed investment | +12.7% |
| Intellectual property products | +8.8% |
| Government spending | +5.3% |
| Consumer spending | +3.8% |
| Real GDP | +3.4% |
| Residential fixed investment | -3.3% |
| Single-family structures | -5.0% |
| Multifamily structures | +0.3% |
| Improvements | +2.7% |
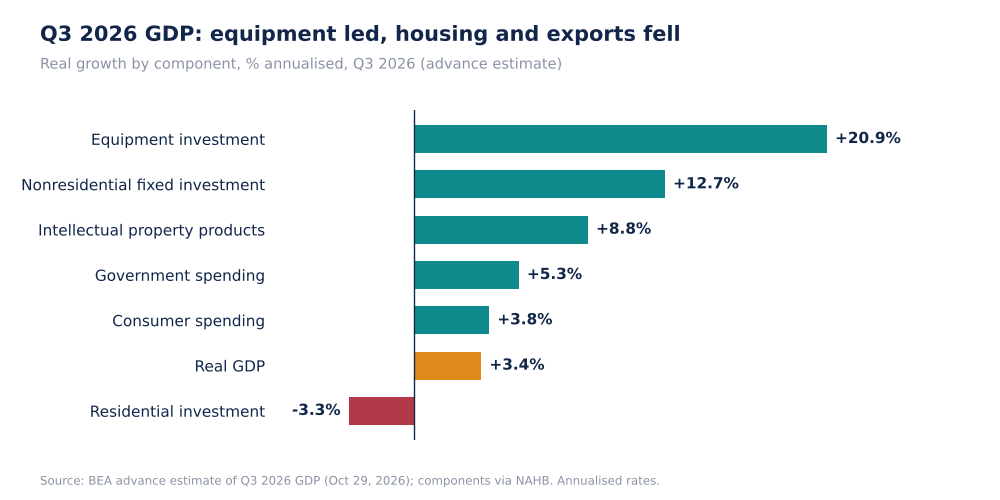
Q3 2026 Real GDP Growth By Component, % Annualised (Self-Made)
The BEA release says investment increased, led by private inventory investment and equipment, and that equipment was led by information processing equipment, mainly computers and peripheral equipment. It does not mention artificial intelligence, and it does not give percentage-point contributions in the extract I read. The company data point the same way: Amazon reported $75.9B of Q3 capital expenditure and Alphabet $51.4B, together $127.3B (d, from the earnings calls used in earlier Stocknote articles), and Texas Instruments said its data center revenue rose about 95%. That spending is global and includes buildings and leased assets, so it is not the same as the U.S. equipment line, but the direction agrees.
Why it matters. A 20.9% increase in equipment spending is a growth source that depends on a small number of buyers. If hyperscaler capital spending slows, the contribution would drop quickly, and the Fed chair himself said higher rates affect AI investment. Investors in the suppliers of this equipment are exposed to the same concentration that supports GDP growth.
Sources: BEA; NAHB. Company capex figures come from Stocknote's earlier Amazon and Alphabet articles; the sum is derived.
Forensic #2: Final Sales Were Stronger Than GDP, Which Implies A Trade Drag
| Measure | Q3 2026 | Q2 2026 |
|---|---|---|
| Real GDP | 3.4% | 2.2% |
| Real final sales to private domestic purchasers | 4.9% | 4.6% |
| Gap (d) | 1.5 points | 2.4 points |
| Nominal GDP | 5.6% | n/a |
| Implied GDP price change, nominal less real (d) | about 2.1% | n/a |
| Gross domestic purchases price index | 3.0% | 5.6% |
| Exports | decreased (petroleum led) | n/a |
| Imports | increased (capital goods the largest contributor) | n/a |
Final sales to private domestic purchasers, which is consumer spending plus private fixed investment, grew 4.9%, which is 1.5 points faster than GDP. Government spending and inventories both rose, so the gap must come from net exports, a conclusion I infer and the release extract does not state in points. The import increase was led by capital goods, which fits the equipment story: some of the domestic equipment boom is supplied from abroad and so does not fully register in GDP. Inventory building in wholesale trade and manufacturing added to growth, and inventories can reverse in a later quarter.
Why it matters. The private domestic demand figure of 4.9% is the cleaner read of underlying demand, and it is higher than the headline. The caution is that two supports, inventories and smaller oil reserve sales, are not durable, so a 3.4% quarter does not necessarily set the pace for the next.
Sources: BEA. Gaps and the implied price change are my arithmetic (d).
Forensic #3: Payroll Growth Is Close To Flat
| Employment Situation, September 2026 | Figure |
|---|---|
| Nonfarm payrolls, September | +29,000 |
| July (revised from +21,000) | -10,000 |
| August (revised from +162,000) | +133,000 |
| Three-month total (d) | +152,000 (about +51,000 a month) |
| 12-month average | +45,000 a month |
| Health care | +17,000 (prior 12-month average +33,000) |
| Government | -17,000 |
| Manufacturing | +9,000 (up 72,000 since the December 2025 low) |
| Construction | +11,000 |
| Financial activities | -7,000 (down 129,000 since the May 2025 peak) |
| Unemployment rate / participation rate | 4.2% / 61.8% |
| Unemployed / long-term unemployed | 7.1 million / 1.9 million (27.1% of unemployed) |
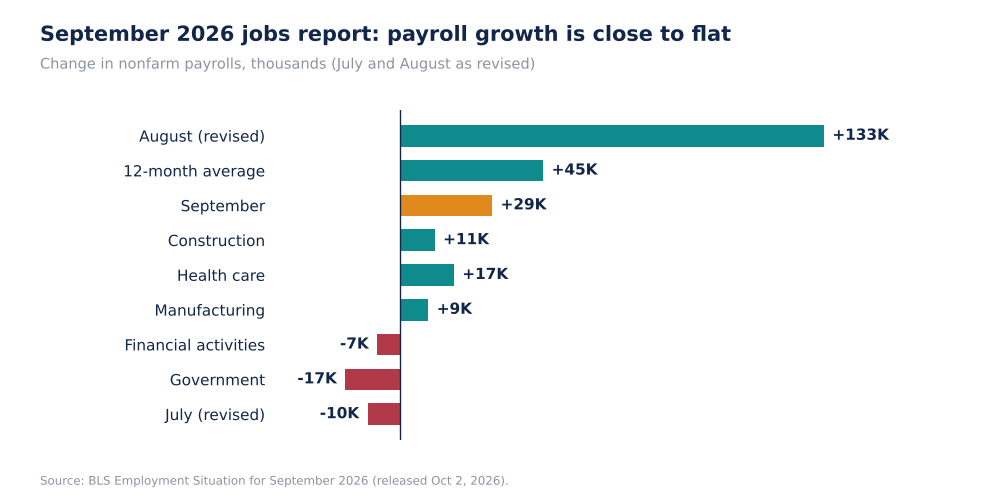
Nonfarm Payroll Changes, Thousands (Self-Made)
Health care, which has been the main source of job growth, added 17,000 in September against an average of 33,000 over the prior twelve months, about half the pace. The four sectors listed above add to only +13,000 (d) of the +29,000 total, so the rest is spread across other industries. Unemployment rose a tenth to 4.2% and participation rose to 61.8%, so the rise in unemployment came with more people looking for work. The Fed statement says job gains have kept pace with the workforce, which implies that labor force growth is also low, though the extract does not say why.
Why it matters. Three months of revised data average about 51,000 a month (d), far below the pace of the preceding years, while GDP grew 3.4%. If that is sustained, the output is coming from productivity and capital, which is consistent with the Fed's statement that productivity growth is strong and capital investment is robust. That favours profit margins and disfavours wage growth, and it matters for the Fed because a labor market that is not tight weakens the case for a hike on wage grounds.
Source: BLS Employment Situation, September 2026. Sums and averages are derived.
Forensic #4: Real Wages Are Falling While Spending Rises
| September 2026 | Average hourly earnings | CPI, all items | Gap (d) |
|---|---|---|---|
| Latest month | +0.1% | +0.6% | -0.5 points |
| 12 months | +3.0% | +3.7% | -0.7 points |
| Average hourly earnings level | $37.81 | n/a | n/a |
| Average workweek | 34.4 hours, unchanged | n/a | n/a |
| Consumer spending, Q3 real growth (annualised) | n/a | +3.8% | n/a |
| Consumer inflation expectations, 12 months (Conference Board) | n/a | 5.8% | n/a |
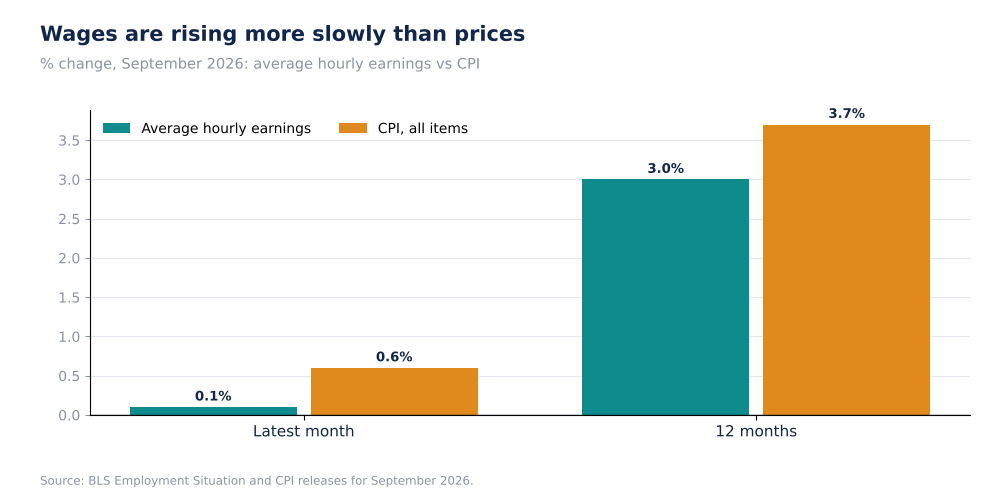
Average Hourly Earnings vs CPI, September 2026, % (Self-Made)
Average hourly earnings lag CPI by 0.7 points over twelve months (d), and by 0.5 points in the month alone (d), mostly because of the energy spike. With the average workweek flat at 34.4 hours and payroll growth near 51,000 a month (d), the aggregate income of workers is not rising fast. The extract I read does not include the personal saving rate or real disposable income, so I cannot say how consumer spending of +3.8% was financed, whether from savings, credit, wealth effects or higher earners. That is the single most important number missing from this analysis.
Why it matters. A consumer who is spending more on falling real income is drawing on something, and when that source weakens the 3.8% pace is at risk. This is also the reason the Fed is split: if wage pressure were the issue, the hawks would have an easier case, but with earnings growth at 3.0% the inflation they are worried about is coming from energy and expectations, not from pay.
Sources: BLS Employment Situation; BLS CPI; Kiplinger, for the Conference Board expectations figure. Gaps are derived.
Valuation Snapshot
This is a macro article, so the snapshot shows the market backdrop on October 28. The Fed held at 3.75% to 4.00%; the 10-year Treasury yield was 5.024%, the 2-year 4.706%; the S&P 500 closed at 7,743, the Dow at 52,475 and the Nasdaq Composite at 26,549 (Kiplinger).
| Measure | Figure |
|---|---|
| Federal funds target range | 3.75% to 4.00% |
| 10-year Treasury yield (Oct 28) | 5.024% |
| 2-year Treasury yield (Oct 28) | 4.706% |
| S&P 500 (Oct 28 close) | 7,743 |
| Real GDP growth Q3 / real final sales to private domestic purchasers | 3.4% / 4.9% |
| 12-month CPI / core CPI (September) | 3.7% / 2.6% |
| Average hourly earnings, 12 months | +3.0% |
A 10-year yield above 5% sits beside GDP growth of 3.4%, so the bond market is pricing a strong economy with persistent inflation, not a slowdown. Equity indices closed higher on the day of the Fed decision.
What has to be true. For the current mix to persist, equipment investment has to keep growing at a double-digit rate, consumers have to keep spending despite falling real wages, and inflation has to stay near its current level without forcing a harder policy response. If capital spending slows, or consumer spending slows toward the weak real income trend, the 3.4% growth rate would fall quickly, and the Fed's December decision would face a different set of data.
Risks: What Would Break The Thesis
- Narrow growth. Equipment (+20.9%) and inventories supplied much of the quarter, and both can reverse.
- Labor market. Payrolls of +29,000, downward revisions of 60,000 and unemployment rising to 4.2%.
- Real income. Hourly earnings 0.7 points behind CPI over twelve months (d).
- Housing. Residential investment fell 3.3% and single-family structures 5.0%.
- Trade. Exports fell and imports of capital goods rose, a drag on measured GDP.
- Data limits. This is an advance estimate subject to revision; I did not retrieve the saving rate, contributions to growth or the September PCE report.
The main risk to a bullish reading is that the consumer, who accounts for most of GDP, is being squeezed. The main risk to a bearish one is that productivity and capital spending are strong enough to keep growth high with little hiring.
What To Watch Next
- The October employment report, against 29,000 payrolls and 4.2% unemployment.
- October CPI, due November 10, and average hourly earnings against +3.0%.
- The Q3 GDP second estimate and corporate profits, due November 25.
- Personal saving rate and real disposable income, which were not in the data I read.
- Hyperscaler capital spending guidance, which supports the equipment line.
- Residential investment after -3.3% and single-family structures after -5.0%.

Sandeep Gupta
Independent equity research analyst publishing forensic theses on US-listed stocks. MBA, Politecnico di Milano School of Management (Milan, Italy).
Get new research in your inbox
Subscribe to receive forensic equity research the moment it's published. Free, no spam.
Related Research
 SPX
Fed Holds At 3.75% To 4.00% With Two Votes To Hike: Headline CPI Is 3.7%, But Core Is 2.6%
 CMCSA
Comcast (CMCSA): Peacock's $478M Swing Drove Media Profit, While Broadband Lost 144K Customers And Free Cash Flow Fell 15%
 DHR
Discussion
Be the first to comment.