
Investment Thesis
Danaher reported third-quarter sales of $6,554M, up from $6,053M, with core sales growth of 3.0% (5.5% excluding respiratory testing) and adjusted diluted EPS of $2.11, up 11.5%. GAAP diluted EPS from continuing operations rose 35% to $1.71, but pre-tax earnings rose only about 5%, and a $263M net discrete tax benefit accounts for most of the difference. Free cash flow rose 19% to $1,632M. The company raised its full-year adjusted EPS guide to $8.57 to $8.62, after acquiring Masimo with debt.
- Sales. $6,554M against $6,053M. Core growth 3.0%, or 5.5% excluding respiratory testing. Acquisitions and divestitures account for the gap to reported growth of 8.5%.
- Segments (core). Biotechnology +5.0%, Life Sciences +4.5%, Diagnostics +0.5% (+7.0% excluding respiratory).
- Profit. Gross margin 58.5% (58.2%), operating profit $1,245M against $1,154M, operating margin 19.0% (19.1%).
- EPS. GAAP continuing $1.71 against $1.27. Adjusted $2.11 against $1.89 (+11.5%), on 706.8M diluted shares.
- Cash. Operating cash flow $1,886M (+13.5%, d), capex $255M, free cash flow $1,632M against $1,370M. Nine-month free cash flow $3,982M against $3,524M.
- Masimo. Acquired in 2026 and financed partly with debt. Nine-month investing outflow was $10,696M and financing inflow $7,057M. Q3 includes $84M of inventory fair-value charges.
- Respiratory. About $350M of sales in Q3 against about $500M. The company forecasts about $1,500M for 2026 against about $1,900M in 2025.
- 2026 guide (raised). Adjusted EPS $8.57 to $8.62 (from $8.45 to $8.60), core growth about 2.5% (mid-single digit excluding respiratory), tax rate about 17%.
- This article contains no price target or rating. Every figure comes from the named source, and anything I calculated is marked (d).
Bottom line. Underlying growth is modest, at 3% core, and Danaher's earnings growth is helped by items that do not describe the business. By my arithmetic a swing in income tax from a $168M expense to a $75M benefit supplies about 81% of the $299M increase in continuing net earnings (d), while pre-tax earnings rose only 5.2% (d). Adjusted EPS, which strips out the discrete tax benefit and acquisition amortisation, is the better guide, and it grew 11.5%.
Source: Danaher Reports Third Quarter 2026 Results, BioSpace.
Q3 2026 At A Glance
| Metric (Q3 2026) | Result | Change |
|---|---|---|
| Sales | $6,554M | +8.5% reported, +3.0% core |
| Core growth excluding respiratory | +5.5% | n/a |
| Operating profit / margin (d) | $1,245M / 19.0% | +8% (d) / from 19.1% |
| GAAP EPS, continuing | $1.71 | from $1.27 |
| Adjusted EPS | $2.11 | +11.5% (from $1.89) |
| Income tax | benefit of $75M | from expense of $168M |
| Operating cash flow / free cash flow | $1,886M / $1,632M | +14% / +19% (d) |
| Respiratory testing sales | about $350M | from about $500M |
| Shares (diluted) | 706.8M | from 713.7M |
Source: Danaher Q3 2026 results press release. Margins and percentage changes marked (d) are my arithmetic on stated figures.
What The Market Believes vs. What The Data Actually Shows
| Belief | What the release shows |
|---|---|
| Sales grew 8.5% | Reported sales grew 8.5%, but core growth was 3.0%. Acquisitions supplied most of the difference. |
| GAAP EPS growth of 35% is strong | Pre-tax earnings rose 5.2% (d). A $263M discrete tax benefit and the swing from expense to benefit did most of the work. |
| Life sciences is recovering strongly | Biotechnology core growth was 5.0%, Life Sciences 4.5%, and both are in the mid-single digits, not a sharp rebound. |
| Diagnostics is stagnant | Diagnostics core growth was 0.5%, but 7.0% excluding respiratory testing, which fell by about $150M (d). |
| Interest costs are manageable | Net interest expense rose to $104M from $64M (d), and the full-year net interest guide is about $305M. |
The shorthand for Danaher is a high-quality life sciences compounder recovering from a downturn. Q3 supports a modest recovery in core demand, with the reported figures flattered by acquisitions and tax.
Forensic #1: Reported Growth, Core Growth And Tariff Refunds
| Bridge, % of prior-year sales | Q3 2026 |
|---|---|
| GAAP sales growth | 8.5% |
| Acquisitions and divestitures | (6.5)% |
| Currency | 0% |
| Tariff refunds to customers (as listed in the bridge) | +1.0% |
| Core sales growth | 3.0% |
| Respiratory testing impact | +2.5% |
| Core growth excluding respiratory | 5.5% |
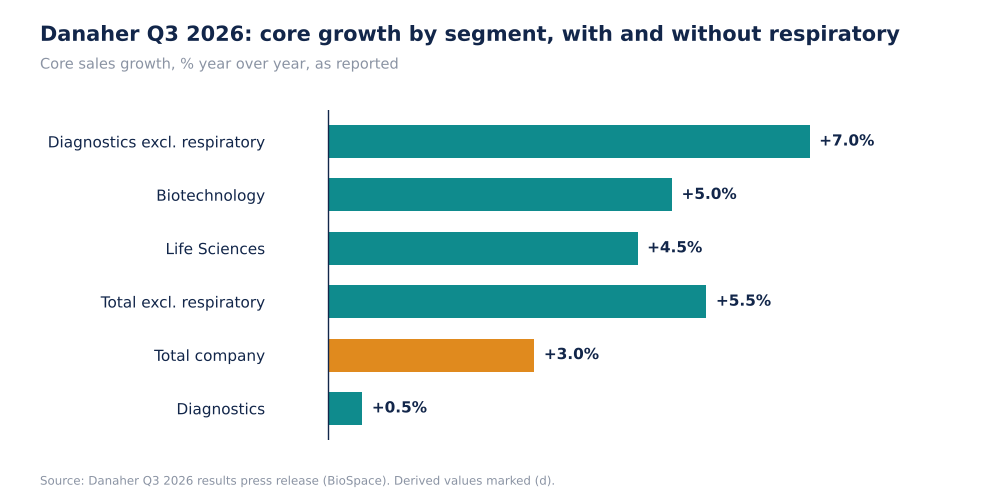
Danaher Q3 2026 Core Sales Growth, % (Self-Made)
The release reconciles GAAP to core growth with a tariff refund line of 1.0 point for the company and 4.0 points in Biotechnology. I read that as refunds paid to customers lowering reported sales and being excluded from core growth, but I did not see the footnote, so I treat it as my reading. If that is right, growth including the refunds would be about 2.0% (d). Nine-month core growth is 2.0% (4.5% excluding respiratory), so Q3 at 3.0% is an improvement on the year.
Why it matters. The difference between 8.5% and 3.0% is mostly acquired sales, which an investor pays for in cash and debt. Core growth is the number that shows demand, and 3.0% is slow for a company valued as a compounder. The gap with and without respiratory (2.5 points) shows how much a single product line is holding back the total.
Source: Danaher Q3 2026 results press release. The reading of the tariff refund line is mine.
Forensic #2: A Tax Swing Supplied Most Of The Net Earnings Increase
| Item, $M | Q3 2025 | Q3 2026 | Change (d) |
|---|---|---|---|
| Operating profit | 1,154 | 1,245 | +91 |
| Net interest (expense less income) | (64) | (104) | -40 |
| Earnings before taxes | 1,076 | 1,132 | +56 (+5.2%) |
| Income tax (expense) or benefit | (168) | 75 | +243 |
| Net earnings, continuing operations | 908 | 1,207 | +299 (+32.9%) |
| Tax swing as share of the increase (d) | n/a | n/a | 81% |
| Net discrete tax benefit in Q3 2026 | n/a | 263 | n/a |
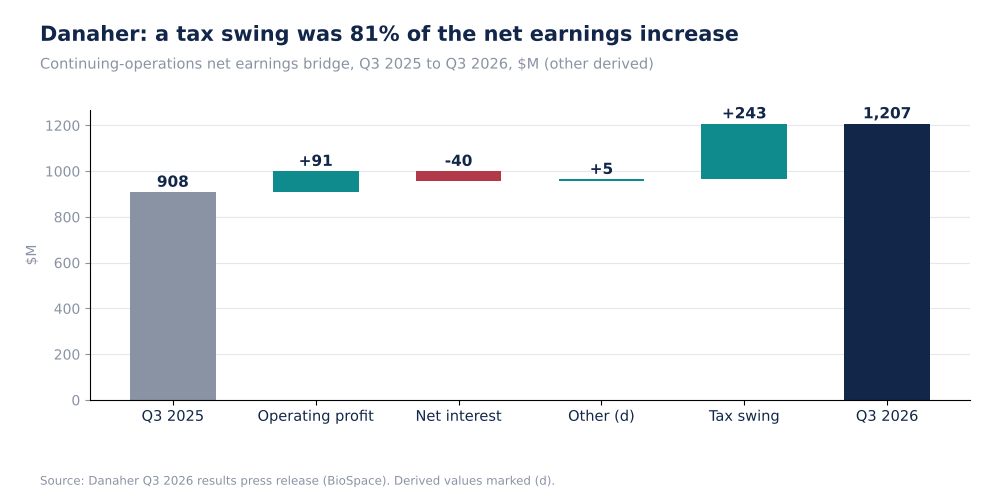
Danaher Net Earnings Bridge, $M (Self-Made)
Operating profit grew 7.9% (d) on sales growth of 8.3% (d), so operating margin was flat at 19.0%. SG&A grew 8.4% (d) and R&D 14.6% (d), faster than sales, while gross margin rose 30 basis points. Interest expense doubled from $67M to $135M, reflecting acquisition debt. Without the tax swing, net earnings would have grown about 6% (d, $56M on $908M, ignoring tax on the pre-tax change).
Why it matters. GAAP EPS growth of 35% will not repeat. Adjusted EPS, which adjusts for the discrete tax benefit ($0.37 a share) among other items, grew 11.5%, and that figure is closer to the operating trend. The adjusted EPS figure also excludes $513M of acquisition amortisation (about $0.73 a share), which is a non-cash cost of past purchases.
Source: Danaher Q3 2026 results press release. Bridge components are derived from the stated income statement.
Forensic #3: Respiratory Testing Is A Declining Drag
| Respiratory testing sales (approximate) | 2025 | 2026 |
|---|---|---|
| Q3 | about $500M | about $350M |
| Q4 | about $500M | about $400M (forecast) |
| Full year | about $1,900M | about $1,500M (forecast) |
| Drag on core growth, Q3 | n/a | 2.5 points |
| Drag on Q4 core growth (guide) | n/a | about 1.5 points |
| Core growth excluding respiratory, Q4 guide | n/a | 4.0% to 5.0% |
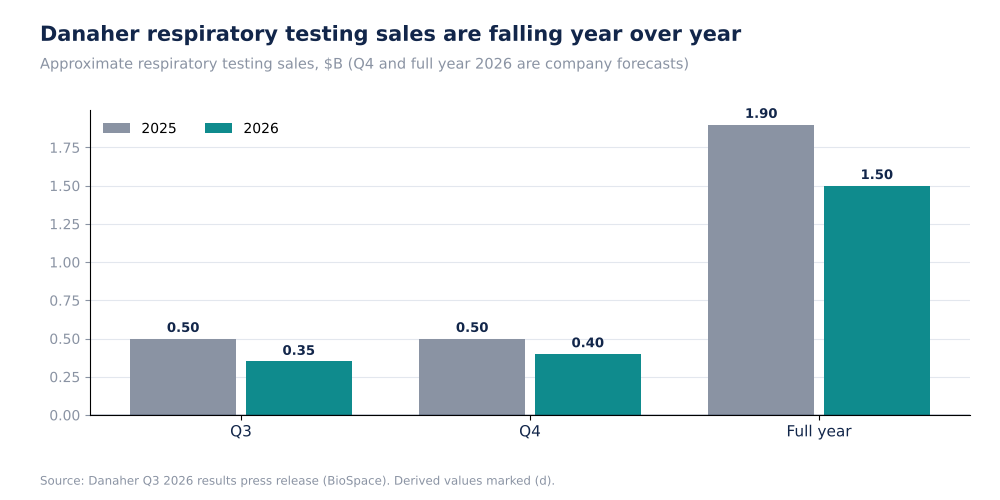
Danaher Respiratory Testing Sales, $B (Self-Made)
Respiratory sales fell about $150M in Q3 (d), 30% below last year. The Q4 forecast of about $400M is a smaller decline of about 20% (d), which reduces the drag on core growth from 2.5 points to about 1.5. The full-year decline is about $400M (d), or 21%. That means the comparison eases and total core growth in Q4, guided at about 3.0%, has an easier base than in Q3.
Why it matters. Diagnostics core growth of 0.5% rises to 7.0% without respiratory, and that gap is the amount by which one product line distorts a segment. As respiratory stabilises, reported core growth should converge on the underlying 4% to 5%. The risk is that respiratory is not stabilising, and the forecast is management's.
Source: Danaher Q3 2026 results press release. Declines are derived from the approximate figures given.
Forensic #4: Cash Flow, The Masimo Purchase And The Raised Guide
| Item | Q3 2025 | Q3 2026 |
|---|---|---|
| Operating cash flow | $1,662M | $1,886M |
| Capex | $292M | $255M |
| Free cash flow | $1,370M | $1,632M |
| Free cash flow / net earnings | 1.51 | 1.35 |
| Nine-month investing cash flow | ($812M) | ($10,696M) |
| Nine-month financing cash flow | ($4,283M) | $7,057M |
| FY adjusted EPS guide | $8.45 to $8.60 | $8.57 to $8.62 |
| FY net interest expense guide | n/a | about $305M |
| FY adjusted EPS guide midpoint change (d) | n/a | +$0.07 (+0.8%) |
Free cash flow of $1,632M is about 109% of adjusted net income of about $1,491M (d, $2.11 times 706.8M shares). Nine-month free cash flow of $3,982M is far below the $10,696M invested in the period, which includes the Masimo purchase, so the acquisition was funded by debt, and financing inflows of $7,057M show that. The guide raise of $0.07 at the midpoint (d) is small. It follows a Q3 adjusted EPS of $2.11, and the extract does not give nine-month adjusted EPS, so I cannot compute the implied Q4.
Why it matters. The debt-funded acquisition raises interest costs, which the guide includes at about $305M a year, and Q3 alone was $104M (d). Danaher's cash generation is strong relative to earnings, so it can service the debt, but the quarter's free cash flow gain should be set against the lower investment in capex and the added interest burden.
Source: Danaher Q3 2026 results press release. Adjusted net income is my estimate (d).
Valuation Snapshot
TradingView shows Danaher at $230.50. The page gives two market caps ($164.40B and $161.64B) and two day changes (-0.73% and -1.76%), so I use price only for the day and compute a market cap from the release: 706.8M diluted shares at $230.50 is about $162.9B (d). Year to date the page shows -0.33%, and the all-time high is $296.02 from September 2021.
| Measure | Figure |
|---|---|
| Share price (TradingView) | $230.50 |
| Market cap (TradingView) | $164.40B or $161.64B (two figures on the page) |
| Market cap from price and diluted shares (d) | about $162.9B |
| Price vs all-time high (d) | about -22% |
| Price / 2026 adjusted EPS guide midpoint ($8.595) (d) | about 26.8 times |
| Annualised Q3 free cash flow ($1,632M x 4) / market cap (d) | about 4.0% |
| Nine-month free cash flow annualised / market cap (d) | about 3.3% |
A multiple of nearly 27 times guided EPS is a premium valuation for core growth of 2.5% in the guide, though the guide excludes respiratory effects that management expects to ease.
What has to be true. At about 27 times adjusted EPS, the price assumes core growth moves toward the mid-single digits that the guide gives excluding respiratory, and that Masimo integrates without margin dilution. If core growth stays near 3%, earnings growth would depend on margin and buybacks.
Risks: What Would Break The Thesis
- Slow core growth. 3.0% in Q3 and about 2.5% for the year, against a premium multiple.
- Earnings quality. GAAP EPS growth depends on a $263M discrete tax benefit.
- Respiratory. A forecast stabilisation that has not yet happened.
- Leverage and interest. Net interest rose to $104M a quarter (d) after the Masimo deal.
- Acquisition costs. $84M of inventory fair-value charges and $79M of nine-month transaction costs, with $513M of quarterly amortisation.
- Data limits. The release does not report segment dollars, bioprocessing or China, and I could not read the last portion of the page.
The main risk is a valuation one: an investor paying for compounding needs core growth to rise, and the Q3 data show a recovery that is real but still modest.
What To Watch Next
- Core growth against about 3.0% for Q4 (4.0% to 5.0% excluding respiratory).
- Respiratory sales against the forecast of about $400M.
- Operating margin against 19.0% GAAP, and the guide of about 29.5% adjusted for Q4.
- Net interest expense against the full-year guide of about $305M.
- Masimo integration costs and inventory fair-value charges.
- Free cash flow conversion against 1.35 times net earnings.

Sandeep Gupta
Independent equity research analyst publishing forensic theses on US-listed stocks. MBA, Politecnico di Milano School of Management (Milan, Italy).
Get new research in your inbox
Subscribe to receive forensic equity research the moment it's published. Free, no spam.

Discussion
Be the first to comment.