
Investment Thesis
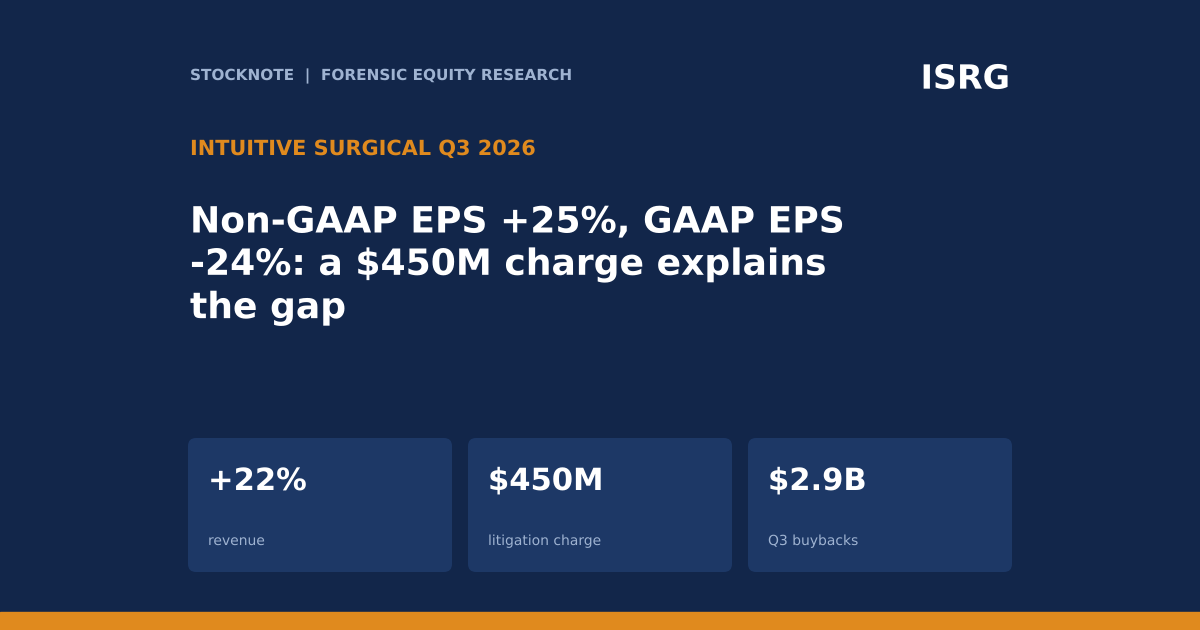
Intuitive Surgical reported third-quarter revenue of $3,048.7M, up 22%, with worldwide procedures up about 15% and da Vinci system placements up 28%. Non-GAAP diluted EPS rose 25% to $3.00 while GAAP diluted EPS fell 24% to $1.49, because GAAP results include a $450M pre-tax charge for an antitrust class action settlement. The business is growing quickly. The questions are how the three profit measures differ, whether capital sales are outgrowing procedures, and how a $2.9B quarterly buyback fits with falling cash.
- Revenue. $3,048.7M (+22%): instruments and accessories $1,797.4M (+18%), systems $769.1M (+30%), services $482.2M (+22%).
- Procedures. Worldwide procedure growth about 15% (da Vinci about 14%, Ion about 31%). da Vinci installed base 12,094 (+12%), Ion installed base 1,152 (+21%).
- Placements. da Vinci 546 against 427 (+28%), of which da Vinci 5 was 315 against 240. Ion 56 against 50.
- Margins. GAAP gross margin 68.4% (+2.0 points), non-GAAP 69.9% (+1.9 points).
- Profit. GAAP operating income $592.6M (-22%), non-GAAP $1,269.7M (+30%). GAAP net income $522.8M (-26%), non-GAAP $1,054.5M (+22%). GAAP EPS $1.49 (-24%), non-GAAP EPS $3.00 (+25%).
- Litigation. A $450M pre-tax charge ($347M after tax, $0.99 a share) for the antitrust class action settlement, which is subject to court approval.
- Cash and buybacks. Cash and investments $6.80B, down $1.83B in the quarter. 7.8M shares repurchased for $2.94B in Q3.
- 2026 guide. da Vinci procedure growth about 14% to 15%, non-GAAP gross margin 68.7% to 69.3% (including about 0.9% of revenue of tariff impact), non-GAAP operating expense growth 11% to 13%.
- This article contains no price target or rating. Every figure comes from the named source, and anything I calculated is marked (d).
Bottom line. The operating momentum is strong and the headline split is mostly a one-time charge: the litigation charge is about two-thirds of the $677M gap between GAAP and non-GAAP operating income (d). Even if litigation is excluded and share-based compensation is kept in, margin still rose by about four points (d). The better question for investors is quality of growth: systems revenue is growing about twice as fast as procedures, and Q3 buybacks were about 2.8 times non-GAAP net income (d).
Source: Intuitive Surgical Q3 2026 earnings release, SEC Exhibit 99.1.
Q3 2026 At A Glance
| Metric (Q3 2026) | Result | Change |
|---|---|---|
| Revenue | $3,048.7M | +22% (d) |
| Worldwide procedure growth | about 15% | da Vinci about 14%, Ion about 31% |
| da Vinci system placements | 546 | +28% (d), from 427 |
| Installed base (da Vinci / Ion) | 12,094 / 1,152 | +12% / +21% (d) |
| Non-GAAP gross margin | 69.9% | +1.9 points |
| GAAP operating income | $592.6M | -22% |
| Non-GAAP operating income | $1,269.7M | +30% |
| GAAP diluted EPS / non-GAAP | $1.49 / $3.00 | -24% / +25% |
| Cash and investments | $6.80B | from $9.03B at Dec 31, 2025 |
Source: Intuitive Surgical Q3 2026 earnings release. Changes marked (d) are my arithmetic on stated figures.
What The Market Believes vs. What The Data Actually Shows
| Belief | What the release shows |
|---|---|
| Earnings fell 24% | GAAP EPS fell 24% because of a $0.99 litigation charge. Excluding it, GAAP EPS would be $2.48 (d), up 27% (d). |
| Non-GAAP shows the true earnings | Non-GAAP excludes $216M of share-based compensation, which is a recurring cost, as well as the one-time charge. |
| Growth is all recurring procedures | Systems revenue grew 30% against procedure growth of about 15%, and the recurring share of revenue fell to about 75% from about 76% (d). |
| Cash is abundant | Cash fell $1.83B in the quarter and $2.23B (d) since year end, and Q3 buybacks were $2.94B. |
| Tariffs are a headwind | The guide includes about 0.9% of revenue in tariff cost on gross margin, but IEEPA refunds added $22M net of tax ($0.06 a share) in Q3. |
The shorthand is that a high-growth leader had a charge. That is mostly right, but a careful reader should also see a capital-sales-led mix, growing use of usage-based leases and a buyback that exceeds what the business earned in the quarter.
Forensic #1: Three Profit Measures, Three Different Stories
| Operating margin | Q3 2025 | Q3 2026 | Change |
|---|---|---|---|
| GAAP (d) | 30.3% | 19.4% | -10.9 pts |
| GAAP excluding the $450M litigation charge (d) | 30.3% | 34.2% | +3.9 pts |
| Non-GAAP (d) | 39.0% | 41.6% | +2.7 pts |
| Gap, non-GAAP less GAAP operating income (d) | $216M | $677M | n/a |
| Of the Q3 2026 gap: litigation (d) | n/a | $450M (66%) | n/a |
| Of the Q3 2026 gap: share-based compensation | $206M | $216M (32%) | n/a |
| Other adjustments (d) | about $10M | about $11M | n/a |
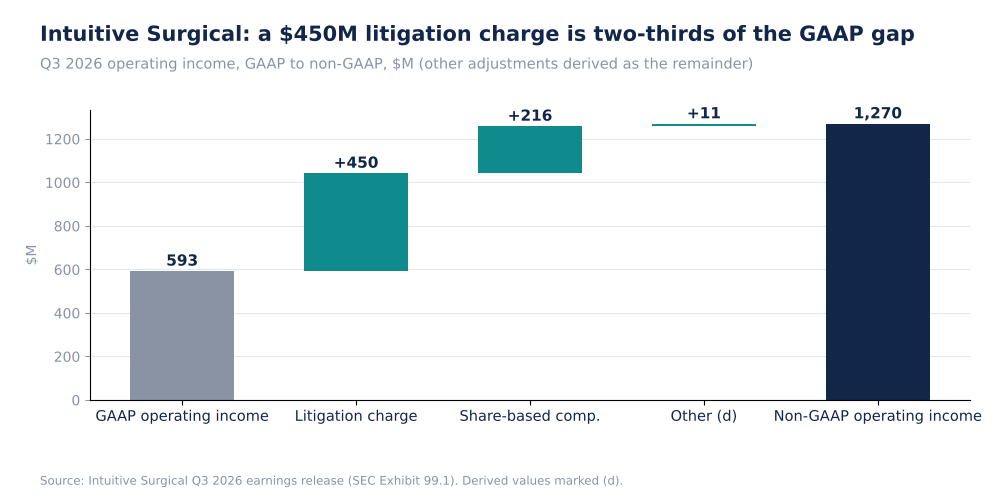
Intuitive Surgical GAAP To Non-GAAP Operating Income, $M (Self-Made)
I assume the prior-year gap of $216M had no litigation charge, which the stated share-based compensation of $206M supports. The measure I find most useful is the middle one: GAAP excluding the litigation settlement, which keeps share-based compensation as a cost. On that basis margin rose about four points (d), roughly in line with the 1.9-point gross margin gain plus operating expense growth slower than revenue growth. Non-GAAP operating expense is guided to grow 11% to 13% for the year against revenue growth of 22% in Q3.
Why it matters. The choice of measure changes the story from a 24% EPS decline to a 25% increase. A settlement is a real cash cost, so it should not be ignored, though it is not an operating run-rate. A cost of $216M a quarter for share-based compensation is real and recurring, and it is about 7.1% of revenue (d), so non-GAAP flatters the margin by that amount.
Source: Intuitive Surgical Q3 2026 earnings release. Margins and the prior-year gap are derived.
Forensic #2: Capital Sales Are Growing Faster Than Procedures
| Item | Q3 2025 | Q3 2026 | Change |
|---|---|---|---|
| Instruments & accessories revenue | $1,518.8M | $1,797.4M | +18.3% |
| Systems revenue | $590.4M | $769.1M | +30.3% |
| Services revenue | $395.9M | $482.2M | +21.8% |
| Recurring proxy (instruments & accessories plus services) / revenue (d) | 76.4% | 74.8% | -1.6 pts |
| da Vinci placements | 427 | 546 | +28% |
| da Vinci 5 placements (share of placements, d) | 240 (56%) | 315 (58%) | +31% |
| Placements under operating lease (d, share) | 231 (54%) | 291 (53%) | +26% |
| Usage-based lease placements | 115 | 160 | +39% |
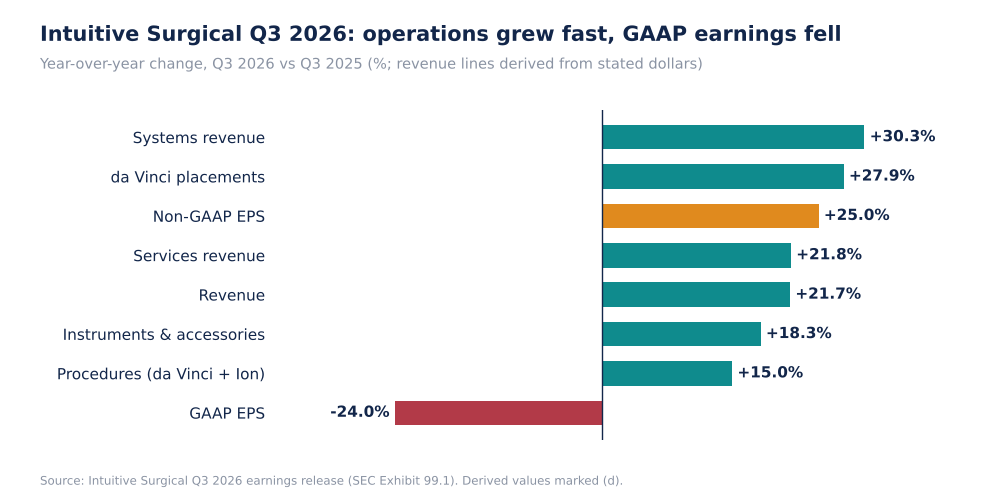
Intuitive Surgical Q3 2026 Year-Over-Year Changes, % (Self-Made)
Instruments and accessories grew 18.3% on procedure growth of about 15%, so revenue per procedure rose about 3% (d). Procedure growth of about 14% for da Vinci against an installed base growth of about 12% implies usage per system rose about 1% to 2% (d). Revenue per placement was about $1.41M (d) against about $1.38M, up 2%, though systems revenue includes items other than new placements. The two lease lines are shown separately in the release extract, and I do not know whether usage-based placements are part of the operating-lease number, so I did not combine them.
Why it matters. Instruments, accessories and services recur with each procedure, and they produce the high margin. A recurring share that is moving down by 1.6 points is not a problem in a year of strong placements, since placements today become procedures later, but it does mean current growth is partly a capital cycle. Usage-based lease placements grew 39%, faster than total placements.
Source: Intuitive Surgical Q3 2026 earnings release. The recurring share is the extraction's own proxy and my arithmetic; the company does not report it.
Forensic #3: Share-Based Compensation And The Quality Of Non-GAAP Earnings
| Item | Q3 2025 | Q3 2026 |
|---|---|---|
| Share-based compensation | $206M | $216M |
| As a share of revenue (d) | 8.2% | 7.1% |
| Diluted shares | 361.8M | 351.6M |
| Share count change (d) | n/a | -2.8% |
| Non-GAAP net income | $867.2M | $1,054.5M |
| Non-GAAP EPS | $2.40 | $3.00 |
| Non-GAAP EPS growth vs non-GAAP net income growth (d) | n/a | +25% vs +22% |
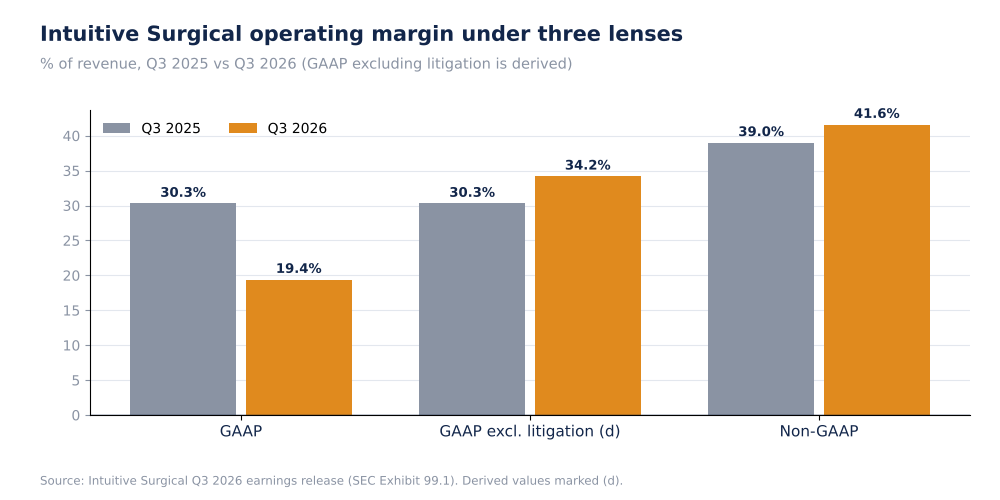
Intuitive Surgical Operating Margin, Three Measures (Self-Made)
Share-based compensation grew 4.9% (d) against revenue growth of 21.7%, so its weight fell, and the gap between non-GAAP and GAAP margin from this item narrowed by about 1.1 points (d). The share count fell 2.8% (d), which added about three points to EPS growth relative to net income growth (non-GAAP EPS +25% against non-GAAP net income +22%).
Why it matters. Buybacks of $2.94B in a quarter partly offset the dilution from share-based pay and shrank the share count, so a share of the EPS growth is financial. An investor who prefers to count share-based pay as a cost should use the GAAP-excluding-litigation figure: $2.48 (d) of EPS, up 27% on $1.95 (d).
Source: Intuitive Surgical Q3 2026 earnings release. GAAP EPS excluding litigation adds the stated $0.99 charge to $1.49 (d).
Forensic #4: Buybacks Exceeded Earnings And Cash Fell
| Item | Figure |
|---|---|
| Q3 share repurchases | 7.8M shares for $2.94B |
| Average repurchase price (d) | about $377 |
| Repurchases / non-GAAP net income (d) | about 2.8 times |
| Cash and investments, Sept 30, 2026 | $6.80B |
| Cash and investments, Dec 31, 2025 | $9.03B |
| Decline in the quarter / since year end | $1.83B / $2.23B (d) |
| Share of the nine-month decline that came in Q3 (d) | about 82% |
| Capex | not reported in the extract; net property and equipment rose about $334M since year end (d) |
| Annualised Q3 repurchases / market cap (d) | about 7.9% |
Spending $2.94B in one quarter against non-GAAP net income of $1,054.5M means the buyback was funded from the balance sheet, and 82% of the nine-month decline in cash came in this one quarter (d). The $450M settlement is not yet paid, since it is subject to court approval, so cash will fall further when it is. At the TradingView price of $432.01, the shares bought at an average of about $377 are up about 15% (d).
Why it matters. The cash cushion of $6.8B is about 4.5% of the market cap (d), and it is smaller than a year of repurchases at the Q3 pace ($11.8B annualised, d), so the pace cannot be sustained without cash generation exceeding it or drawing the balance down. The settlement payment adds another $450M claim.
Source: Intuitive Surgical Q3 2026 earnings release. Average price and ratios are derived.
Valuation Snapshot
TradingView shows Intuitive Surgical at $432.01, down 3.73% on the day, with a market cap of $149.75B and a year-to-date decline of 23.78%. The all-time high shown is $616.00 on Jan 23, 2025. The page says "market closed".
| Measure | Figure |
|---|---|
| Share price (TradingView) | $432.01 |
| Market cap (TradingView) | $149.75B |
| Price vs all-time high (d) | about -30% |
| Price / annualised non-GAAP Q3 EPS ($3.00 x 4) (d) | about 36.0 times |
| Price / annualised GAAP Q3 EPS excluding litigation ($2.48 x 4) (d) | about 43.5 times |
| Cash and investments / market cap (d) | about 4.5% |
| Annualised Q3 repurchases / market cap (d) | about 7.9% |
The annualised figures assume Q3 is a representative quarter, which is generous for a business with seasonality in capital sales that the extract does not describe. The GAAP multiple of 43.5 times is the more conservative figure.
What has to be true. At 36 to 44 times annualised earnings, the price assumes procedure growth of 14% to 15% continues, operating expense growth of 11% to 13% stays below revenue growth, and tariff and lease dynamics do not compress margin. The price is down 30% from its high despite the growth, so some of that growth may already be discounted.
Risks: What Would Break The Thesis
- Procedure growth slowing. Guided at about 14% to 15% for da Vinci, which is the base of recurring revenue.
- Capital cycle. Systems revenue growing about twice as fast as procedures, and the recurring share of revenue falling 1.6 points (d).
- Tariffs. The gross margin guide includes about 0.9% of revenue of tariff cost, and the Q3 refund of $22M net of tax is not a recurring offset.
- Settlement. $450M subject to court approval, and not yet paid.
- Buyback pace. $2.94B against $1,054.5M of non-GAAP net income, and cash down $1.83B.
- Data limits. The extract did not include capex, utilization, or the guide for revenue.
None of these is a demand problem, since placements and procedures both rose strongly. They are about measurement and capital allocation, which is why the choice of earnings measure matters here more than for most companies.
What To Watch Next
- Court approval and payment timing of the $450M settlement, and the cash balance of $6.80B.
- da Vinci procedure growth against the 14% to 15% guide, and Ion growth against 31%.
- Systems revenue and placements against procedure growth, and the recurring share (d) against 74.8%.
- Non-GAAP gross margin against the 68.7% to 69.3% full-year guide.
- Non-GAAP operating expense growth against 11% to 13%.
- Buyback pace against operating cash flow.

Sandeep Gupta
Independent equity research analyst publishing forensic theses on US-listed stocks. MBA, Politecnico di Milano School of Management (Milan, Italy).
Get new research in your inbox
Subscribe to receive forensic equity research the moment it's published. Free, no spam.

Discussion
Be the first to comment.