
Investment Thesis
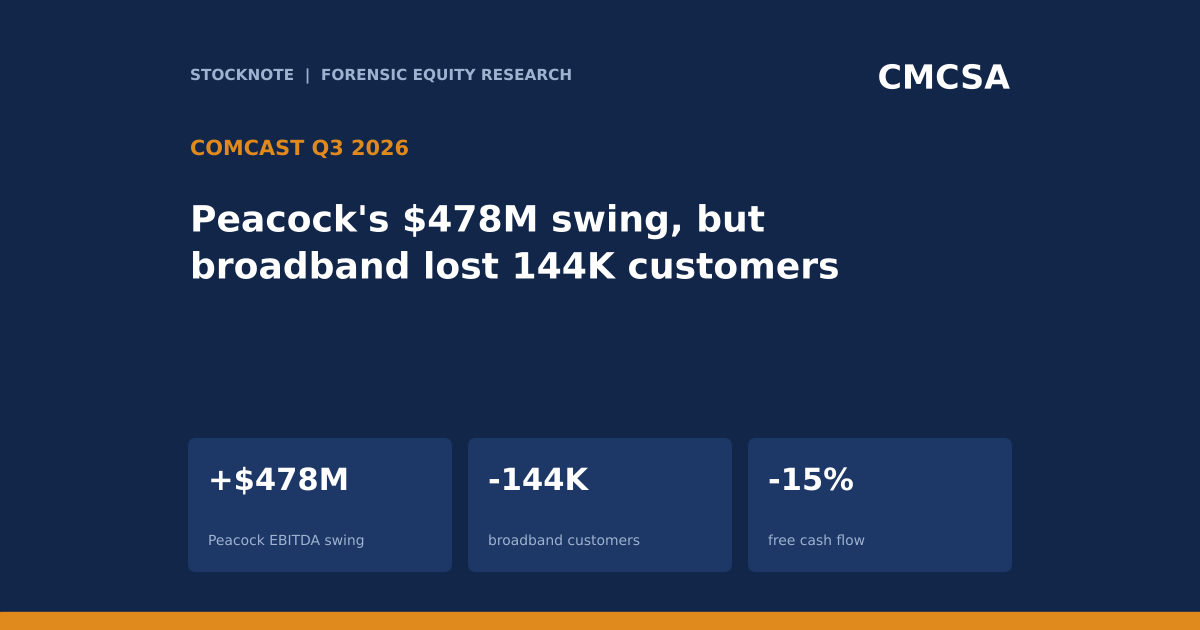
Comcast reported third-quarter revenue of $29,298M, down 6.1% as reported and up 0.5% on a pro forma basis that excludes Versant, and adjusted EBITDA of $9,106M, up 0.8% pro forma. Diluted EPS rose 7.2% to $0.97, while adjusted EPS fell 4.0% to $1.07. Beneath those headline figures, profit growth came from media, and in particular from a $478M improvement at Peacock, while Connectivity & Platforms lost $350M of EBITDA and broadband lost 144,000 customers. Free cash flow fell 14.8%, buybacks are suspended, and a separation of NBCUniversal and Sky is proposed.
- Consolidated. Revenue $29,298M (-6.1%, pro forma +0.5%), adjusted EBITDA $9,106M (-5.8%, pro forma +0.8%), net income $3,448M (+3.5%), diluted EPS $0.97 (+7.2%), adjusted EPS $1.07 (-4.0%).
- Connectivity & Platforms. Revenue $19,663M (-2.7%), adjusted EBITDA $7,588M (-4.4%), margin 38.6% against 39.3%. Residential revenue -3.5%, Business Services revenue +2.7%.
- Customers. Domestic broadband 28,343K, net loss of 144K against 91K a year ago. Wireless lines 10,555K, net additions 368K against 414K. Video net loss 274K against 257K.
- Content & Experiences. Revenue $10,537M (+6.5%), adjusted EBITDA $1,800M (+29.3%). Media EBITDA $769M against $247M. Studios $402M (+18.6%). Theme Parks $780M (-17.1%).
- Peacock. Adjusted EBITDA of $261M against a $217M loss, revenue $1.8B against $1.4B, 48 million paid subscribers (+17%).
- Cash. Operating cash flow $7,902M (-9.1%), free cash flow $4,211M (-14.8%), capex $3,058M (flat). Total debt about $87.4B against about $98.9B at Dec 31, 2025.
- Capital returns. Dividends of $1.2B in Q3. Buybacks suspended from Q3 and expected to stay paused through the proposed separation. Nine-month repurchases $2,517M against $5,618M.
- This article contains no price target or rating. Every figure comes from the named source, and anything I calculated is marked (d).
Bottom line. The reported 7.2% EPS increase and the 4.0% adjusted EPS decline are both correct, and the gap between them is the story: GAAP earnings include items that adjusted earnings exclude. The operating picture is a shift in where profit comes from. Peacock's $478M swing equals about 92% of the Media EBITDA increase (d) and more than the entire $408M Content & Experiences increase (d), so without it the segment's profit would have fallen. Meanwhile the largest business, broadband, is losing customers faster.
Source: Comcast Q3 2026 earnings release, SEC Exhibit 99.1.
Q3 2026 At A Glance
| Metric (Q3 2026) | Result | Change |
|---|---|---|
| Revenue | $29,298M | -6.1% reported, +0.5% pro forma |
| Adjusted EBITDA | $9,106M | -5.8% reported, +0.8% pro forma |
| Diluted EPS / adjusted EPS | $0.97 / $1.07 | +7.2% / -4.0% |
| Connectivity & Platforms adjusted EBITDA | $7,588M | -4.4% |
| Content & Experiences adjusted EBITDA | $1,800M | +29.3% |
| Domestic broadband net additions | -144K | from -91K |
| Peacock paid subscribers | 48M | +17% |
| Free cash flow | $4,211M | -14.8% |
| Total debt (d) | about $87.4B | from about $98.9B at Dec 31, 2025 |
Source: Comcast Q3 2026 earnings release. Total debt is my sum of current and noncurrent debt from the balance sheet (d).
What The Market Believes vs. What The Data Actually Shows
| Belief | What the release shows |
|---|---|
| Revenue fell 6%, so the business is shrinking | Most of the 6.1% decline is Versant leaving. Pro forma revenue rose 0.5%. |
| EPS grew 7% | GAAP EPS did, but adjusted EPS fell 4.0% and adjusted net income fell 7.3%. |
| Peacock is a drag | Peacock earned $261M of adjusted EBITDA against a $217M loss a year ago, a $478M swing (d). |
| Content is a strong second leg | Media and Studios rose, but Theme Parks EBITDA fell 17.1% and Content & Experiences growth depends on the Peacock swing. |
| Cash returns are stable | Buybacks are suspended, free cash flow fell 14.8% and debt fell $11.6B (d), and debt reduction is the visible use of cash. |
The usual framing is a mature cable business funding a media portfolio. Q3 shows the reverse in momentum: the media side improved sharply, mostly through one streaming service moving from loss to profit, while the cable-broadband side lost EBITDA and customers.
Forensic #1: Media Gained, Connectivity And Parks Lost
| Segment adjusted EBITDA | Q3 2025 | Q3 2026 | Change (d) |
|---|---|---|---|
| Media | $247M | $769M | +$522M |
| Studios | $339M | $402M | +$63M |
| Theme Parks | $940M | $780M | -$160M |
| Content & Experiences | $1,392M | $1,800M | +$408M |
| Connectivity & Platforms | $7,938M | $7,588M | -$350M |
| Segments combined | $9,330M | $9,388M | +$58M |
| Consolidated (including corporate and other) | $9,669M | $9,106M | -$563M reported, +$68M pro forma |
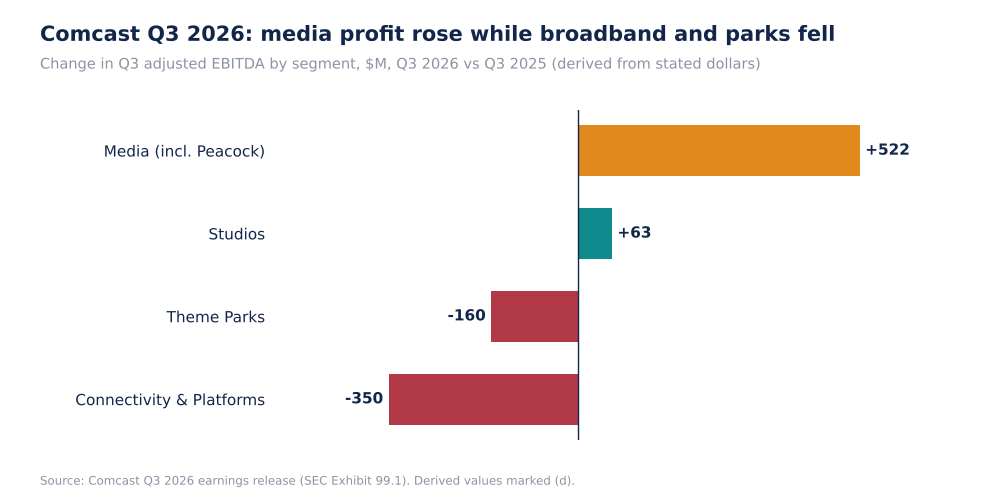
Comcast Change In Adjusted EBITDA By Segment, $M (Self-Made)
The sum of the two main segments rose only $58M (d), so a large media gain was matched by connectivity and parks declines. Peacock's swing of $478M is 92% of the Media increase (d) and 117% of the Content & Experiences increase (d), which means the other businesses in that segment net to a small decline. Corporate and eliminations were about -$282M (d, consolidated less the two segments), and the consolidated reported decline mostly reflects Versant leaving.
Why it matters. A turnaround from a loss to a profit happens once. Peacock's $261M of EBITDA is a level, and growth from it requires subscriber and revenue gains from here, while the connectivity EBITDA decline of 4.4% in Q3 is moving in the other direction. The investor needs to decide which of these two is the faster-moving number.
Source: Comcast Q3 2026 earnings release. Differences and sums are derived from stated segment figures.
Forensic #2: Broadband Losses Widened, And Wireless Adds Slowed
| Customers | Q3 2025 | Q3 2026 | Detail |
|---|---|---|---|
| Domestic broadband net additions | -91K | -144K | loss 58% larger (d); base 28,343K |
| Domestic wireless net additions | +414K | +368K | -11% (d); 10,555K lines against 8,941K |
| Domestic video net additions | -257K | -274K | n/a |
| Residential revenue | $17,636M | $17,018M | -3.5% |
| Residential adjusted EBITDA | $6,484M | $6,110M | -5.8% |
| Residential EBITDA margin (d) | 36.8% | 35.9% | -0.9 pts |
| Business Services revenue | $2,576M | $2,645M | +2.7% |
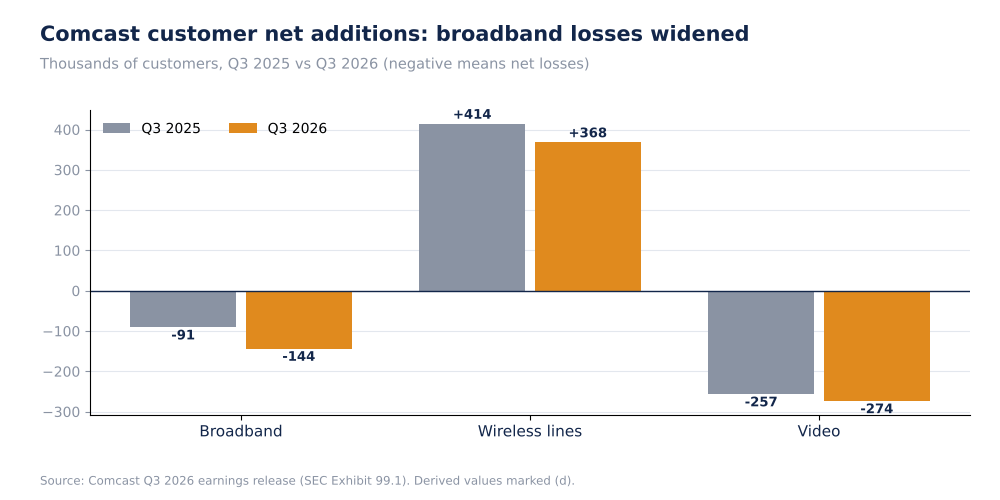
Comcast Customer Net Additions, Thousands (Self-Made)
A net loss of 144,000 broadband customers is 0.5% of the base (d), which does not sound large, but it is the second element of a trend: the loss is 58% larger than a year ago, and residential revenue fell 3.5%. Wireless lines grew 18% year over year (d), so the base is expanding in a different product, though net additions slowed. Residential EBITDA fell faster than residential revenue (-5.8% against -3.5%), which is consistent with losing high-margin broadband customers while adding wireless lines.
Why it matters. The connectivity segment generates about 81% of segment EBITDA (d, $7,588M of $9,388M), and its $350M decline offsets about two-thirds of the Media gain (d). Broadband net losses widening is the lead indicator for its future revenue and margin, and the release extract does not report average revenue per user.
Source: Comcast Q3 2026 earnings release. Percentages and margins are derived.
Forensic #3: Peacock Moved Into Profit, But The Level Is Small
| Peacock | Q3 2025 | Q3 2026 | Change |
|---|---|---|---|
| Adjusted EBITDA | -$217M | $261M | +$478M (d) |
| Revenue | $1.4B | $1.8B | +29% (d) |
| Paid subscribers | about 41M (d) | 48M | +17% |
| EBITDA margin (d) | n/a | about 14.5% | n/a |
| Share of Media EBITDA increase (d) | n/a | n/a | 92% |
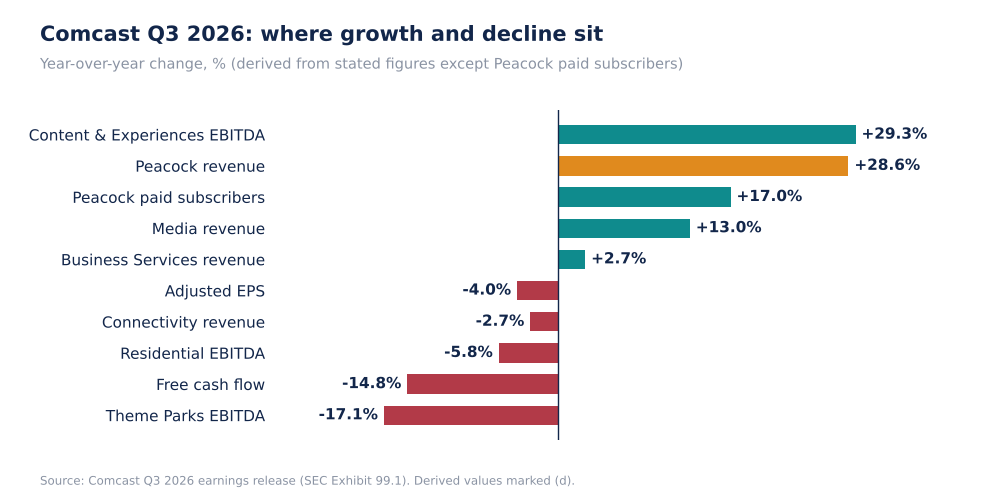
Comcast Q3 2026 Year-Over-Year Changes, % (Self-Made)
Peacock's revenue grew about 29% (d) on 17% subscriber growth, which suggests revenue per subscriber is rising (price or advertising, which the extract does not split). A margin of about 14.5% on $1.8B of revenue is $261M, against $4,211M of free cash flow in the quarter. The prior-year subscriber count of about 41M is derived from 48M and +17%.
Why it matters. The swing is large in change terms and small in level terms: Peacock's $261M is about 2.9% of consolidated adjusted EBITDA (d). If it keeps growing revenue at 29% with margin gains, it can add meaningful profit within a few quarters, but a single quarter does not establish the trend, and the Media segment's earnings also depend on sports and advertising timing that the extract does not describe.
Source: Comcast Q3 2026 earnings release. Prior-year subscriber count and margin are derived.
Forensic #4: Free Cash Flow Fell, Debt Fell, And Buybacks Stopped
| Item | Figure |
|---|---|
| Operating cash flow | $7,902M (-9.1%) |
| Free cash flow | $4,211M (-14.8%); nine months $12,716M against $14,866M |
| Free cash flow / adjusted EBITDA (d) | 46% (51% a year ago) |
| Capex | $3,058M (flat); Connectivity & Platforms $2.4B (+3.6%), Content & Experiences $639M (-10.6%) |
| Total debt (d) | about $87,366M against about $98,937M at Dec 31, 2025 (-$11.6B) |
| Nine-month debt repayments | $10,405M |
| Dividends | $1.2B in Q3; $3,606M for nine months |
| Share repurchases | suspended from Q3; nine months $2,517M against $5,618M |
| Free cash flow less Q3 dividends (d) | about $3.0B |
Cash conversion of EBITDA fell from 51% to 46% (d) while capex was flat, so the decline is in operating cash flow, which fell $791M (d). The release extract does not itemise working capital or cash taxes. Debt fell about $11.6B in nine months (d), more than the $6.6B left from nine-month free cash flow after dividends and buybacks (d). The extract does not explain the difference, and Versant's separation may be one factor. The company says buybacks will stay paused through the proposed separation of NBCUniversal and Sky, and the release lists $22M of Q3 transaction costs for it.
Why it matters. Buybacks were a source of per-share growth, and the suspension removes it: nine-month repurchases of $2,517M had already halved from last year. Investors are now relying on debt reduction and the dividend, and a split into two companies changes what each part's cash flow supports.
Source: Comcast Q3 2026 earnings release. Debt total and ratios are derived.
Valuation Snapshot
TradingView shows Comcast at $23.22, up 4.27% on the day, with a market cap of $82.45B and a year-to-date decline of 17.06%. The page says "market closed".
| Measure | Figure |
|---|---|
| Share price (TradingView) | $23.22 |
| Market cap (TradingView) | $82.45B |
| Price / annualised Q3 adjusted EPS ($1.07 x 4) (d) | about 5.4 times |
| Annualised Q3 free cash flow ($4.2B x 4) / market cap (d) | about 20% |
| Annualised dividends ($1.2B x 4) / market cap (d) | about 5.8% |
| Gross debt / annualised adjusted EBITDA (d) | about 2.4 times |
| Market cap plus gross debt / annualised adjusted EBITDA (d) | about 4.7 times (before cash) |
These are mechanical ratios on one quarter and are unusually low for a large company, so they are best read as the market's price for risk, not as a forecast: declining broadband, a proposed separation and suspended buybacks. Gross debt overstates enterprise value because the extract did not include cash.
What has to be true. At about 5 times annualised adjusted EPS and a 20% free cash flow yield, the price assumes free cash flow will keep falling or that the separation will leave the parts worth less than the sum. For the stock to look cheap, broadband losses need to stabilise and Peacock needs to keep rising.
Risks: What Would Break The Thesis
- Broadband. A net loss of 144K, 58% larger than last year, in the segment that supplies about 81% of segment EBITDA (d).
- Dependence on Peacock. A $478M swing was larger than the whole Content & Experiences increase.
- Theme Parks. EBITDA fell 17.1% on revenue down 4.4%.
- Cash flow. Free cash flow fell 14.8% and conversion fell from 51% to 46% of EBITDA (d).
- Separation. The proposed NBCUniversal and Sky split will change the capital structure and the dividend base.
- Data limits. The extract did not include ARPU, segment-level separation notes, or cash.
The risks are about the direction of the largest business, not about debt, which is falling. A reader who values the stock on its cash flow should weigh how long the broadband trend can continue.
What To Watch Next
- Broadband net additions against the 144K loss, and residential EBITDA margin against 35.9% (d).
- Peacock adjusted EBITDA against $261M and subscribers against 48M.
- Theme Parks EBITDA against the 17.1% decline.
- Free cash flow conversion against 46% of EBITDA (d), and debt against about $87.4B.
- Any update on the NBCUniversal and Sky separation, and on when buybacks resume.
- Wireless net additions against 368K, since the base is growing in this product.

Sandeep Gupta
Independent equity research analyst publishing forensic theses on US-listed stocks. MBA, Politecnico di Milano School of Management (Milan, Italy).
Get new research in your inbox
Subscribe to receive forensic equity research the moment it's published. Free, no spam.
Related Research
 O
Realty Income’s 671 Consecutive Monthly Dividends And A 235bps Acquisition Spread Make The Rate-Sensitivity Label Wrong (O)
 DHR
Danaher (DHR): Core Sales Up 3% And Adjusted EPS Up 11.5%, But A Tax Swing Was 81% Of The Net Earnings Gain
 SPX
Discussion
Be the first to comment.