
Investment Thesis
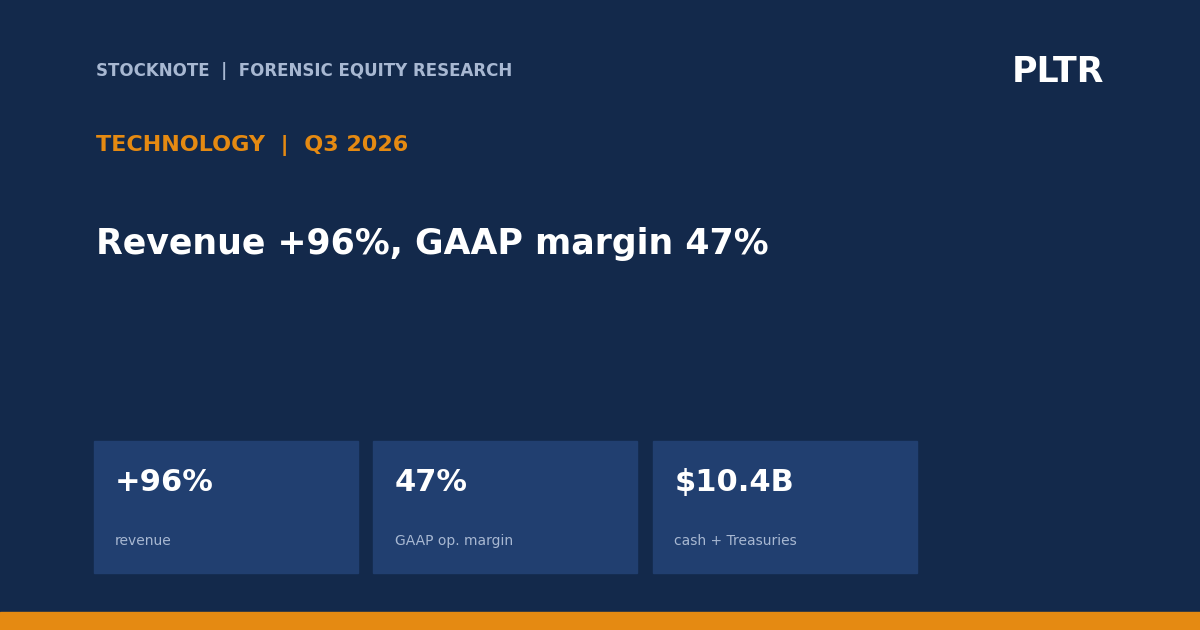
Palantir reported Q3 2026 revenue of $2,313.4M, up 96%, and GAAP operating income of $1,084.8M, a 47% margin. U.S. commercial revenue reached $984M and surpassed U.S. government revenue of $953M for the first time. The quarter is unusual for both growth and profitability, but the 62% adjusted operating margin excludes stock-based compensation and related payroll taxes; the $342.0M gap (d) is 15% of revenue (d).
- Revenue. $2,313.4M, +96% y/y and +20% q/q.
- Mix. U.S. commercial $984M; U.S. government $953M.
- Profit. GAAP operating margin 47%; adjusted margin 62%.
- Cash. Operating cash flow $1,204.6M; adjusted free cash flow $1,216.1M.
- Outlook. Q4 revenue midpoint $2.651B; full-year revenue midpoint $8.532B.
- This article contains no rating, price target or investment advice. Derived figures are marked (d).
Bottom line. The core result is not only growth: GAAP profitability and cash conversion are already high. The forensic question is how much of the 15-point adjusted margin gap should be treated as a recurring employee cost rather than ignored as non-cash.
Source: Palantir Q3 2026 earnings release (8-K Ex. 99.1).
Q3 2026 At A Glance
| Measure | Q3 2026 |
|---|---|
| Revenue | $2,313.4M |
| U.S. commercial revenue | $984M |
| U.S. government revenue | $953M |
| GAAP operating income | $1,084.8M |
| Adjusted operating income | $1,426.8M |
| Adjusted free cash flow | $1,216.1M |
Source: Palantir Q3 2026 earnings release (8-K Ex. 99.1). Derived figures are marked (d).
What The Market Believes vs. What The Data Actually Shows
| Belief | What the data show |
|---|---|
| Government remains the U.S. growth engine | U.S. commercial surpassed government and grew 148% versus 96%. |
| Adjusted and GAAP profit tell the same story | Both are strong, but the operating-income gap is $342.0M (d). |
| TCV grew as fast as revenue | TCV rose only 6% while revenue rose 96%. |
| Cash flow is weaker than accounting profit | Operating cash flow exceeded GAAP operating income by $119.7M (d). |
Forensic #1: Commercial Versus Government
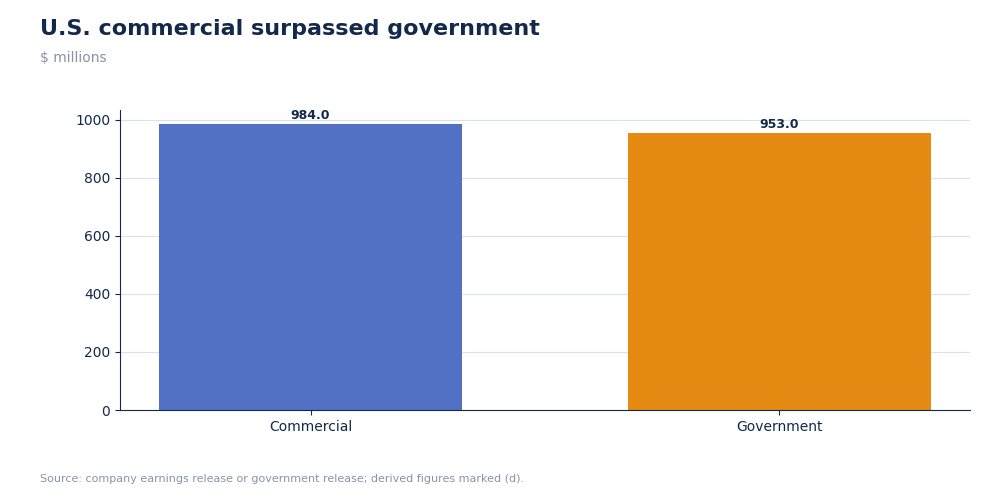
Business mix matters because commercial contracts can scale differently from government programs. The crossover marks a structural change in the U.S. franchise.
| U.S. revenue | Q3 2026 | y/y | q/q |
|---|---|---|---|
| Commercial | $984M | +148% | +29% |
| Government | $953M | +96% | +18% |
| Total | $1,937M | +119% | +23% |
Palantir U.S. commercial and government revenue
Commercial exceeded government by $31M (d). U.S. revenue was 84% of consolidated revenue (d), leaving $376M of non-U.S. revenue (d).
Why it matters. The fastest-growing business is now the largest U.S. line, increasing operating leverage but also raising the comparison base.
Source: Palantir Q3 2026 earnings release (8-K Ex. 99.1)
Forensic #2: GAAP Versus Adjusted Operating Margin
Stock compensation is non-cash in the period but economically dilutive. Comparing GAAP and adjusted operating income sizes that cost.
| Operating measure | Q3 2026 |
|---|---|
| GAAP operating income | $1,084.8M |
| Adjusted operating income | $1,426.8M |
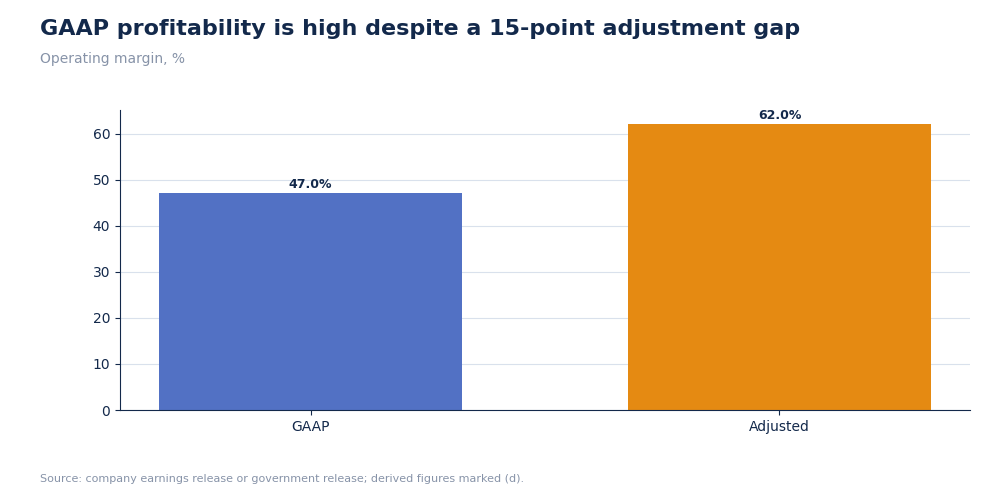
| Adjustment gap | $342.0M (d) |
| GAAP margin | 47% |
| Adjusted margin | 62% |
Palantir GAAP and adjusted operating margin
The adjustment gap equals 24% of adjusted operating income (d) and 15% of revenue (d). GAAP margin is still exceptional, so the critique is about degree, not whether the business is profitable.
Why it matters. A valuation based on adjusted profit should separately account for dilution.
Source: Palantir Q3 2026 earnings release (8-K Ex. 99.1)
Forensic #3: Revenue Versus Contract Activity
TCV measures contracts signed, while revenue measures delivery under current and prior contracts. Divergence can reflect timing, duration and backlog conversion.
| Measure | Q3 2026 | Growth |
|---|---|---|
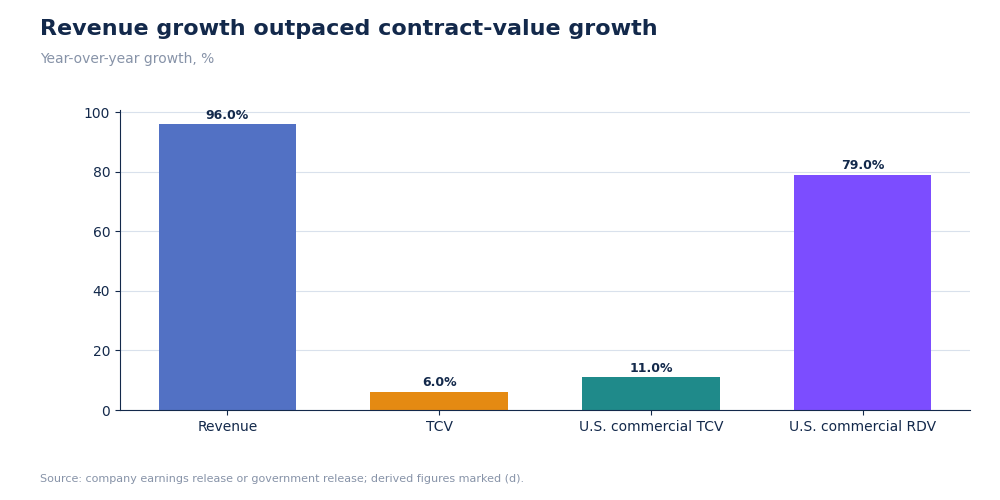
| Revenue | $2.313B | +96% |
| Total contract value | $2.918B | +6% |
| U.S. commercial TCV | $1.463B | +11% |
| U.S. commercial RDV | $6.517B | +79% |
Palantir revenue, TCV and remaining deal value
Revenue growth exceeded TCV growth by 90 points. RDV growth of 79% is closer to revenue growth and supports future visibility, but not all remaining value converts on the same schedule.
Why it matters. Rapid revenue growth needs replenishment through contract activity to remain durable.
Source: Palantir Q3 2026 earnings release (8-K Ex. 99.1)
Forensic #4: Cash Conversion And Guidance
Cash conversion tests whether reported profit is supported by collections and working capital.
| Measure | Q3 2026 |
|---|---|
| GAAP operating income | $1,084.8M |
| Operating cash flow | $1,204.6M |
| Adjusted free cash flow | $1,216.1M |
| Cash flow / revenue | 52% |
| Adjusted FCF / revenue | 53% |
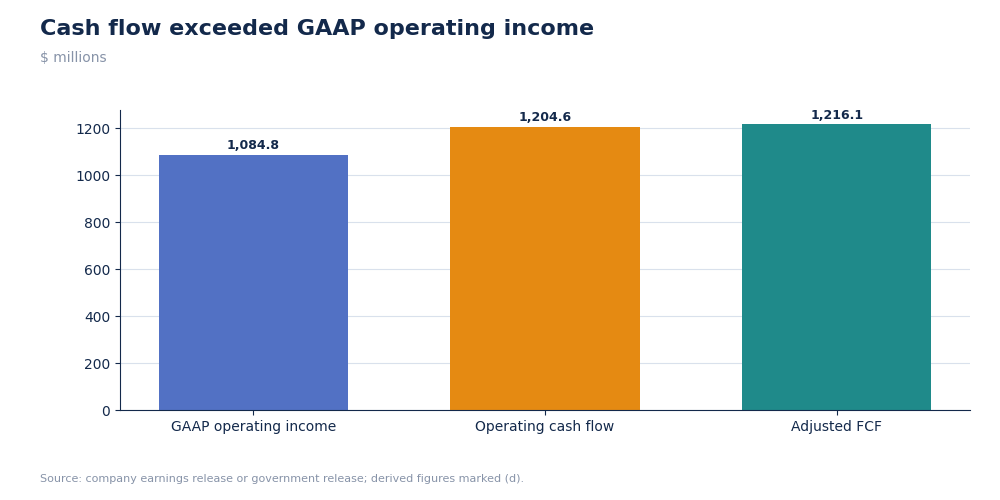
Palantir profit and cash flow, Q3 2026
Operating cash flow exceeded GAAP operating income by 11% (d), and adjusted free cash flow slightly exceeded operating cash flow because the company-defined measure includes its own adjustments. The full-year adjusted FCF guide is $4.8B-$5.0B.
Why it matters. The growth is cash generative, reducing dependence on external financing.
Source: Palantir Q3 2026 earnings release (8-K Ex. 99.1)
Valuation Snapshot
At $178.34 per share, Palantir had a market capitalization of $458.10B and a reported trailing P/E of 152.43x. The midpoint of 2026 revenue guidance values the equity at 53.7x sales (d), while the midpoint of adjusted free-cash-flow guidance implies a 1.07% yield (d).
| Measure | Value |
|---|---|
| Share price | $178.34 |
| Market capitalization | $458.10B |
| Reported trailing P/E | 152.43x |
| Market cap / 2026 revenue guide | 53.7x (d) |
| Market cap / annualized Q4 revenue guide | 43.2x (d) |
| Price / adjusted FCF guide | 93.5x (d) |
| Adjusted FCF yield | 1.07% (d) |
Investment read-through. The valuation already discounts extraordinary growth. Even if annual revenue reached $15B, 76% above 2026 guidance (d), the current market capitalization would still equal 30.5x sales (d). The operating result is exceptional, but the stock requires both continued hypergrowth and sustained margins; either one alone is insufficient.
What has to be true. Commercial growth must remain unusually high for several years, GAAP margin must hold, and dilution must not consume the value created by adjusted profit.
Source: Market quote, market capitalization and trailing P/E from the in-session U.S. equity market feed; revenue and FCF guidance from Palantir's Q3 2026 SEC exhibit. Market data: latest quote retrieved after the November 2, 2026 U.S. trading session.
Risks: What Would Break The Thesis
- Contract timing. Revenue growth greatly exceeded TCV growth.
- Stock compensation. It remains excluded from adjusted margins.
- Concentration. U.S. revenue was 84% of total (d).
- Growth base. Future comparisons become much harder.
The reading would be too cautious if the commercial platform sustains near-triple-digit growth with stable GAAP margin.
What To Watch Next
- U.S. commercial growth against 148%.
- GAAP operating margin against 47%.
- TCV growth against 6%.
- U.S. commercial RDV against $6.517B.
- Q4 revenue against the $2.651B midpoint.

Sandeep Gupta
Independent equity research analyst publishing forensic theses on US-listed stocks. MBA, Politecnico di Milano School of Management (Milan, Italy).
Get new research in your inbox
Subscribe to receive forensic equity research the moment it's published. Free, no spam.
Discussion
Be the first to comment.