
Investment Thesis
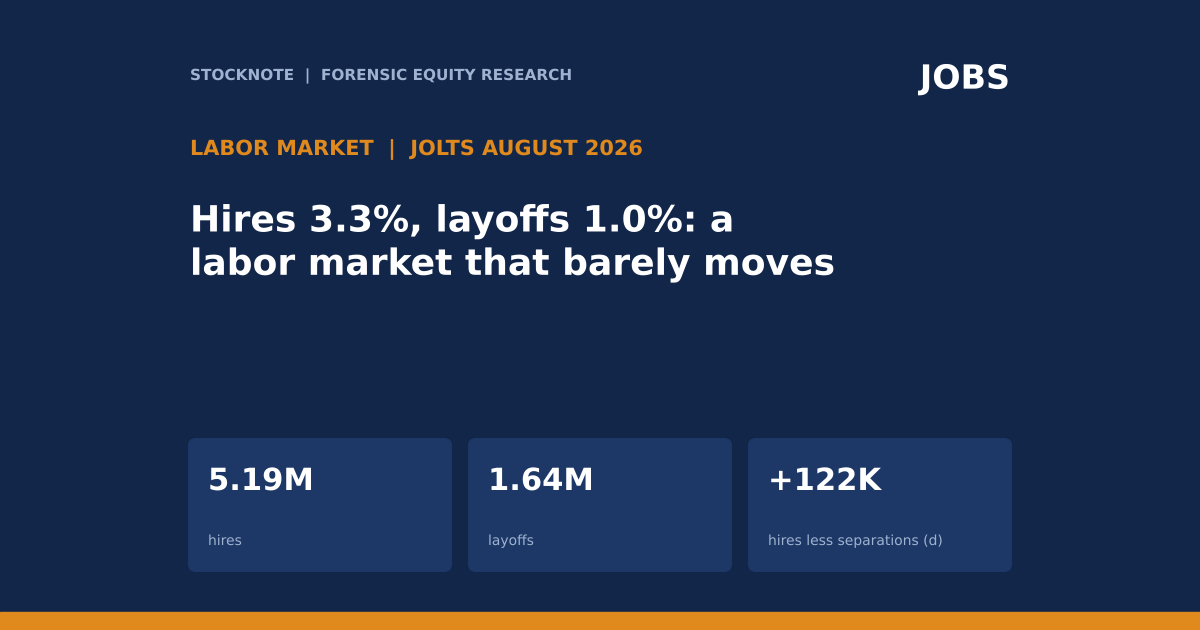
The Bureau of Labor Statistics' Job Openings and Labor Turnover Survey (JOLTS) for August 2026 shows a labor market in which few people are hired and few are laid off. Job openings were 7.079 million (a rate of 4.3%), hires 5.192 million (3.3%), quits 3.066 million (1.9%) and layoffs and discharges 1.641 million (1.0%). Hires exceeded total separations of 5.070 million by 122,000 (d), almost the same as the 133,000 revised gain in August payrolls from the separate establishment survey. The rate of layoffs is lower than a year ago (1.2%), but the quits rate is also lower (2.0% to 1.9%) and September payrolls rose only 29,000. This article explains how to read flow data, why a low-hire, low-fire market is a different thing from a strong one, and what it implies for the Fed.
- Openings. 7,079K, -256K from July and +160K from August 2025; rate 4.3% (4.4% in July, 4.2% a year ago). July was revised up to about 7.3 million.
- Hires. 5,192K (+46K m/m, +47K y/y); rate 3.3%.
- Quits. 3,066K (-23K m/m, -29K y/y); rate 1.9%.
- Layoffs and discharges. 1,641K (-61K m/m, -191K y/y); rate 1.0% (1.2% a year ago).
- Separations. 5,070K total (3.2% rate); other separations 363K.
- Payrolls and unemployment. September payrolls +29,000; August revised to +133,000; July revised to -10,000; unemployment 4.2%; 7.1 million unemployed, 1.9 million of them for 27 weeks or more.
- This article contains no rating, price target or investment advice. Every figure comes from a named source and anything I calculated is marked (d).
Bottom line. The labor market is not deteriorating through layoffs; the layoff rate is falling. It is stagnating through lack of hiring and lack of switching: the hires rate (3.3%) and the quits rate (1.9%) are both low, and openings per unemployed person are close to one (d). Workers who lose or leave jobs find it harder to find new ones, and workers who have jobs are not leaving for better pay, which also limits wage growth (average hourly earnings +3.0% over twelve months against CPI 3.7%). For the Fed, the data give no evidence of a tight labor market that would justify tightening on wage grounds; its case for further hikes rests on inflation.
Sources: BLS JOLTS, August 2026; BLS Employment Situation, September 2026; Federal Reserve statement, Oct 28, 2026.
August 2026 At A Glance
| Measure | Level (thousands) | Rate | Change vs July | Change vs Aug 2025 |
|---|---|---|---|---|
| Job openings | 7,079 | 4.3% | -256 | +160 |
| Hires | 5,192 | 3.3% | +46 | +47 |
| Quits | 3,066 | 1.9% | -23 | -29 |
| Layoffs and discharges | 1,641 | 1.0% | -61 | -191 |
| Total separations | 5,070 | 3.2% | -58 | -137 |
| Other separations | 363 | 0.2% | +26 | +83 |
Source: BLS JOLTS, preliminary August 2026. JOLTS figures are revised the following month.
What The Market Believes vs. What The Data Actually Shows
| Belief | What the data show |
|---|---|
| Layoffs are rising | The layoff rate fell to 1.0% from 1.2% a year earlier, and the level fell 191,000 (-10.4%, d). |
| A strong job market means many openings | Openings are 7.079 million, but hires are 5.192 million, which is 73% of openings (d); the gap has not turned into hiring. |
| Workers have bargaining power | The quits rate is 1.9% against 2.0% a year ago, and quits are 60% of separations (d). Wage growth is 3.0%, below CPI inflation. |
| Weak payrolls mean job destruction | Hires exceeded separations by 122,000 (d), so the labor market added jobs in August; the issue is the small size of that net. |
| Unemployment is stable | It rose from 4.1% to 4.2% in September, and 27.1% of the 7.1 million unemployed have been out of work for 27 weeks or more (1.9 million). |
The JOLTS and payroll surveys are separate and use different methods, so the closeness of 122,000 (hires less separations, JOLTS) and 133,000 (August payrolls, revised) may be partly coincidence. They point in the same direction: a small net gain.
Forensic #1: Rates That Do Not Move
| Rate (% of employment) | Aug 2025 | Jul 2026 | Aug 2026 |
|---|---|---|---|
| Job openings | 4.2 | 4.4 | 4.3 |
| Hires | 3.2 | 3.2 | 3.3 |
| Quits | 2.0 | 1.9 | 1.9 |
| Layoffs and discharges | 1.2 | 1.1 | 1.0 |
| Total separations | 3.3 | 3.2 | 3.2 |
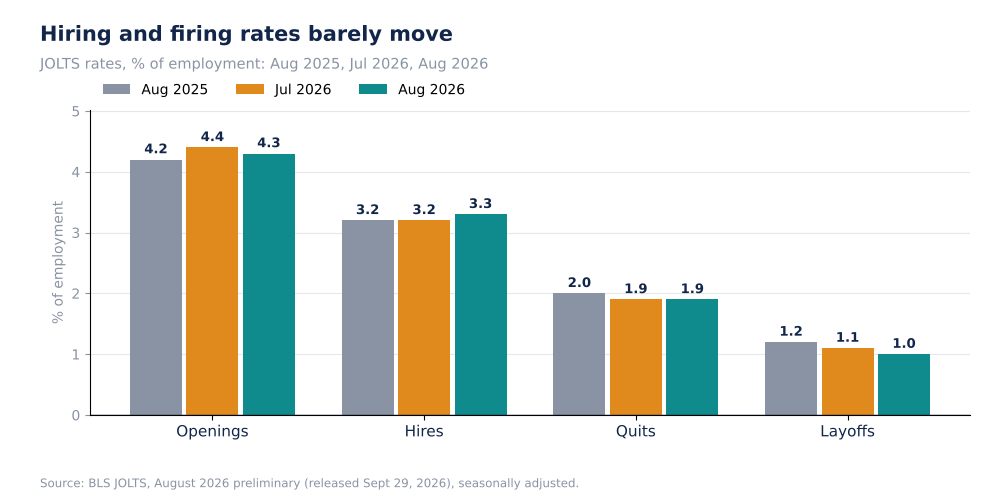
JOLTS Rates, Aug 2025 Vs Jul And Aug 2026, % (Self-Made)
Over a year, no rate in the table has moved by more than 0.2 points (openings 4.2 to 4.3; hires 3.2 to 3.3; quits 2.0 to 1.9; layoffs 1.2 to 1.0; separations 3.3 to 3.2). In a dynamic market, the hires rate would be well above the separations rate in an expansion and the reverse in a downturn. Here the difference is 0.1 points (d), so employment is growing by only about 0.1% of the workforce in the month (d), roughly the 122,000 net hires shown below.
Why it matters. Low turnover means the labor market is slow to adjust in either direction. For the unemployed, a hires rate of 3.3% and a smaller gap between openings and hires suggest long searches, which fits the 1.9 million long-term unemployed. For the Fed, low quits reduce the risk of a wage-price spiral.
Source: BLS JOLTS. The net rate gap is my arithmetic (d).
Forensic #2: Where Separations Come From
| Separations, August 2026 | Level (thousands) | Share of total (d) |
|---|---|---|
| Quits | 3,066 | 60.5% |
| Layoffs and discharges | 1,641 | 32.4% |
| Other separations | 363 | 7.2% |
| Total separations | 5,070 | 100% |
| Hires | 5,192 | n/a |
| Hires less separations (d) | +122 | n/a |
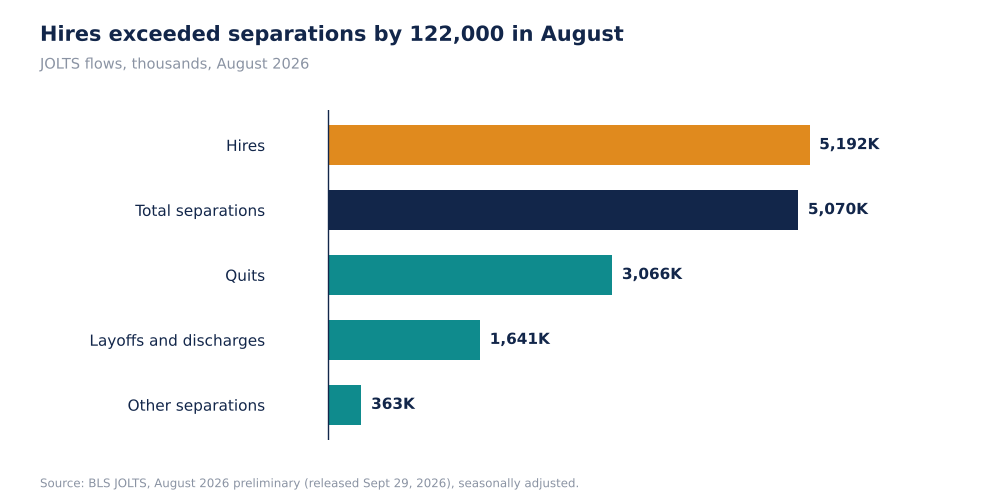
JOLTS Flows, Thousands, August 2026 (Self-Made)
Voluntary quits are 60.5% of separations (d), and layoffs 32.4% (d). A rise in the layoff share would signal that employers are cutting; a fall in the quits share would signal that workers are not confident enough to move. The extract gives both levels for August and the changes from July and a year earlier: layoffs fell 61,000 in the month and 191,000 over the year, and quits fell 23,000 and 29,000. So the decline in separations over the year (-137,000, d) is mainly layoffs (-191,000), partly offset by an increase in other separations (+83,000).
Why it matters. The decline in separations has come from involuntary departures, which is a positive for workers; the decline in voluntary departures, a smaller change, is a sign of caution. Together they describe a market where employers are holding on to staff and employees are holding on to jobs.
Source: BLS JOLTS. Shares and differences are my arithmetic (d).
Forensic #3: Openings By Industry
| Industry | Openings, Aug 2026 (K) | Change from July (K) |
|---|---|---|
| Health care and social assistance | 1,359 | -115 |
| Professional and business services | 1,186 | -119 |
| Trade, transportation and utilities | 1,287 | +43 |
| Leisure and hospitality | 829 | +61 |
| Retail trade | 761 | +54 |
| Manufacturing | 522 | -54 |
| Construction | 251 | -48 |
| Finance and insurance | 353 | +49 |
| Information | 123 | +45 |
| Government | 731 | -42 |
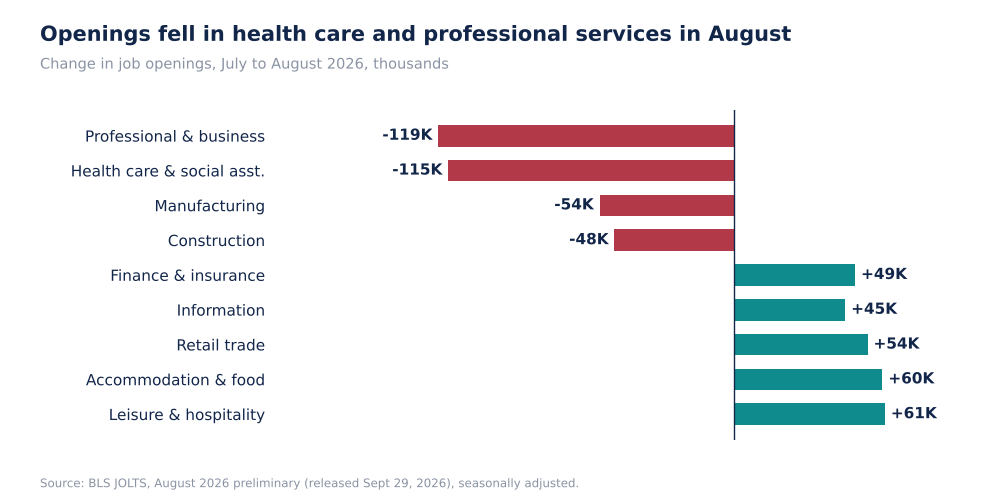
Change In Job Openings By Industry, July To August 2026, Thousands (Self-Made)
Health care and social assistance, which has been the largest source of net job growth (September payrolls +17,000 in health care against a prior twelve-month average of 33,000, per the BLS), lost 115,000 openings in a month, and professional and business services lost 119,000. Offsetting increases came in leisure and hospitality (+61,000), accommodation and food services (+60,000) and retail trade (+54,000), sectors that typically pay less. Openings in manufacturing (-54,000) and construction (-48,000) fell. The monthly changes are preliminary and July was revised up by 64,000, so single-month moves in industry data are noisy.
Why it matters. The sector that has supplied job growth is showing fewer openings, and the sectors with rising openings are lower-wage. If that persists it could lower the average wage growth seen in next month's data, and it reinforces the point that payroll growth is narrow.
Sources: BLS JOLTS; BLS Employment Situation. Single-month changes are preliminary.
Forensic #4: Reading JOLTS Together With Payrolls And Prices
| Indicator | Latest | Source |
|---|---|---|
| Payrolls, September | +29,000 | BLS Employment Situation |
| August payrolls (revised) | +133,000 | BLS Employment Situation |
| Unemployment rate | 4.2% (4.1% in August) | BLS Employment Situation |
| Average hourly earnings, 12 months | +3.0% | BLS Employment Situation |
| CPI, 12 months | 3.7% | BLS CPI |
| Real hourly earnings change (d) | -0.7 points | derived |
| Openings per unemployed, mixed months (d) | about 1.0 | 7.079M / 7.1M |
| Fed statement | Job gains have kept pace with the workforce | Federal Reserve, Oct 28 |
Openings per unemployed worker is a standard measure of labor market tightness. The figure here is about 1.0 (d), using August openings and September unemployment, which are different months, so treat it as an approximation. A ratio near one means there is roughly one opening for each unemployed person, a balanced market and not a tight one. This matches the Fed's October statement that job gains have kept pace with the workforce and that unemployment has changed little. The Fed voted 10-2 to hold with two dissenters wanting a hike; the JOLTS and wage data do not obviously support that view on labor-market grounds, so the argument appears to rest on inflation, which was 3.7% in September.
Why it matters. The combination of low turnover, a balanced ratio of openings to unemployed and 3.0% wage growth means that the labor market is not the source of inflation pressure. For investors, the exposure is the reverse: it supports profit margins (wages growing more slowly than prices) but limits consumer income growth.
Sources: BLS JOLTS; BLS Employment Situation; Federal Reserve. Derived figures marked (d).
Valuation Snapshot
This is a macro article, so no single valuation applies. The labor-market readings to track are:
| Measure | Level |
|---|---|
| Openings / hires / quits / layoffs, Aug 2026 | 7.079M / 5.192M / 3.066M / 1.641M |
| Hires rate / quits rate / layoffs rate | 3.3% / 1.9% / 1.0% |
| Unemployment rate (Sept) | 4.2% |
| Average hourly earnings y/y | +3.0% |
| Fed funds range | 3.75% to 4.00% |
What has to be true. For this to stay a stable low-turnover market and not the start of a downturn, layoffs have to remain near 1.0% of employment, hires have to stay above separations, and unemployment must not rise further from 4.2%. If the layoff rate climbed back toward 1.2% or above while hires stayed at 3.3%, net hiring would turn negative.
Risks: What Would Break The Thesis
- Layoffs. A rise from 1.0% would turn a stagnant market into a shrinking one.
- Revisions. JOLTS figures are preliminary; July was revised up by 64,000 openings.
- Timing. The data are for August; September JOLTS had not been published in my sources.
- Concentration. Health care openings fell 115,000 in a month.
- Survey differences. JOLTS and payroll numbers can diverge; their August agreement may be coincidence.
- Data limits. I did not retrieve a Beveridge-curve history, so I cannot place the current ratio in a historical range.
The argument could be wrong if the low flow rates reflect a smaller labor force and not weak demand, in which case 29,000 payrolls might be enough to keep unemployment steady. The 0.1 point rise in unemployment in September, with participation at 61.8%, makes that less likely but the extracts do not settle it.
What To Watch Next
- September JOLTS, for the layoff rate against 1.0% and hires against 3.3%.
- The October employment report and unemployment against 4.2%.
- Health care openings and payrolls after the fall in openings.
- Average hourly earnings against +3.0% and CPI against 3.7%.
- The December FOMC, where labor-market language may change.
- Openings per unemployed worker once both series are for the same month.

Sandeep Gupta
Independent equity research analyst publishing forensic theses on US-listed stocks. MBA, Politecnico di Milano School of Management (Milan, Italy).
Get new research in your inbox
Subscribe to receive forensic equity research the moment it's published. Free, no spam.


Discussion
Be the first to comment.