
Investment Thesis
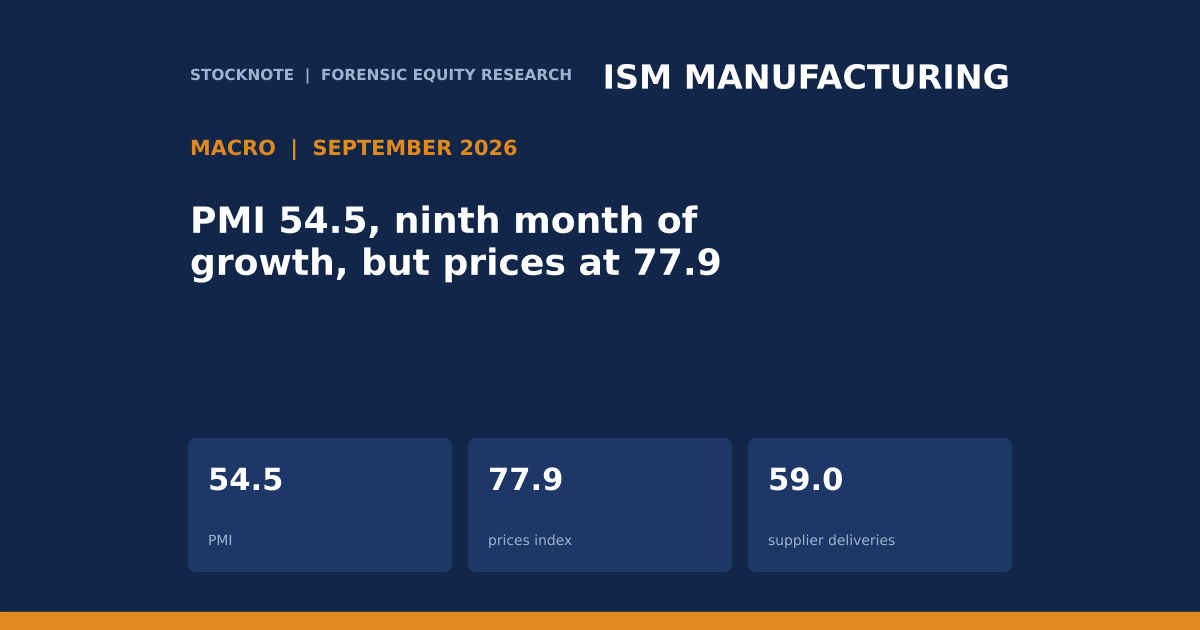
The Institute for Supply Management's September manufacturing index was 54.5, down from 54.6 in August and below the 55.0 consensus, but still the ninth consecutive month above 50. The headline looks steady; the detail is not. The prices index rose to 77.9 from 71.1, supplier deliveries were 59.0, and inventories were 48.6. Respondents cited steel and aluminum, tariffs, and petroleum-linked costs from the Middle East conflict. Strong activity and sharply rising input prices at the same time are the pattern that matters for margins and for the Fed.
- Headline. PMI 54.5 (August 54.6; consensus 55.0); ninth straight month of expansion.
- Components. New orders 55.3; production 56.7; employment 52.7; supplier deliveries 59.0; inventories 48.6.
- Other indexes. Prices 77.9 (August 71.1); export orders 50.9; backlog of orders 56.4.
- Source caveat. I could not open the ISM report itself; the figures come from a First Trust summary of it. Treat them as secondary until checked against ISM.
- This article contains no rating, price target or investment advice. Derived figures are marked (d).
Bottom line. The PMI is the average of five components, and one of them, supplier deliveries, rises when suppliers are slower, which is a sign of bottlenecks and not of strength. Without it, the average of the other four is 53.3 (d), a full point lower than the headline. Activity is expanding, but part of the headline is supply-chain friction, and the prices index at 77.9 says that costs are rising far faster than activity.
Source: First Trust summary of the ISM Manufacturing report, Sept 2026.
September 2026 At A Glance
| ISM index | September | August |
|---|---|---|
| Manufacturing PMI | 54.5 | 54.6 |
| New orders | 55.3 | n/a |
| Production | 56.7 | n/a |
| Employment | 52.7 | n/a |
| Supplier deliveries | 59.0 | n/a |
| Inventories | 48.6 | n/a |
| Prices | 77.9 | 71.1 |
| Export orders | 50.9 | n/a |
| Backlog of orders | 56.4 | n/a |
Source: First Trust (secondary). August values for individual components are not in my extract (n/a).
What The Market Believes vs. What The Data Actually Shows
| Belief | What the data show |
|---|---|
| Manufacturing is booming | The PMI is 54.5, comfortably above 50, and has been for nine months; but it was below the 55.0 consensus. |
| The headline measures demand | One component, supplier deliveries (59.0), measures how slow suppliers are. Excluding it the average falls to 53.3 (d). |
| Inflation pressure is easing | The prices index rose 6.8 points (d) to 77.9; the extract has no longer history to compare it with. |
| Employment is strengthening | The employment index is 52.7, the lowest of the four components above 50; the September jobs report showed +29K payrolls. |
| Inventories are being built ahead of price rises | The inventories index is 48.6, below 50, so more respondents reported falling inventories than rising. |
Falling inventories alongside rising prices do not suggest firms are stocking up ahead of further increases; the extract does not say why.
Forensic #1: How The PMI Is Built
| Component | Index |
|---|---|
| New orders | 55.3 |
| Production | 56.7 |
| Employment | 52.7 |
| Supplier deliveries | 59.0 |
| Inventories | 48.6 |
| Simple average of five (d) | 54.5 |
| Reported PMI | 54.5 |
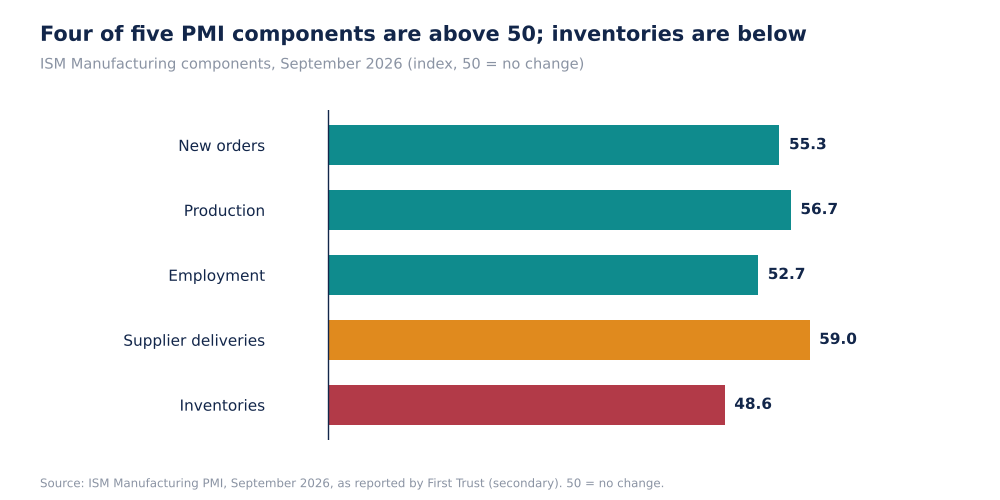
ISM Manufacturing Components, September 2026 (Self-Made, ISM Data Via First Trust)
The simple average of the five components is 54.5 (d), which matches the reported 54.5 to rounding, so the headline is consistent with an equal-weighted average. A diffusion index measures the share of respondents reporting an increase, plus half the share reporting no change; 50 is neutral. Supplier deliveries is inverted in the sense that slower deliveries push it above 50.
Why it matters. Supplier deliveries contributes 1.8 points (d) of the headline's 4.5 points above 50, about 40% (d). A reader who uses the PMI as a demand gauge should know that part of it reflects delays.
Sources: First Trust. Averages and contributions are my arithmetic (d).
Forensic #2: Headline Versus Ex-Deliveries
| Measure | Value |
|---|---|
| Headline PMI | 54.5 |
| Average of new orders, production, employment, inventories (d) | 53.3 |
| Difference (d) | 1.2 |
| New orders less inventories (d) | 6.7 |
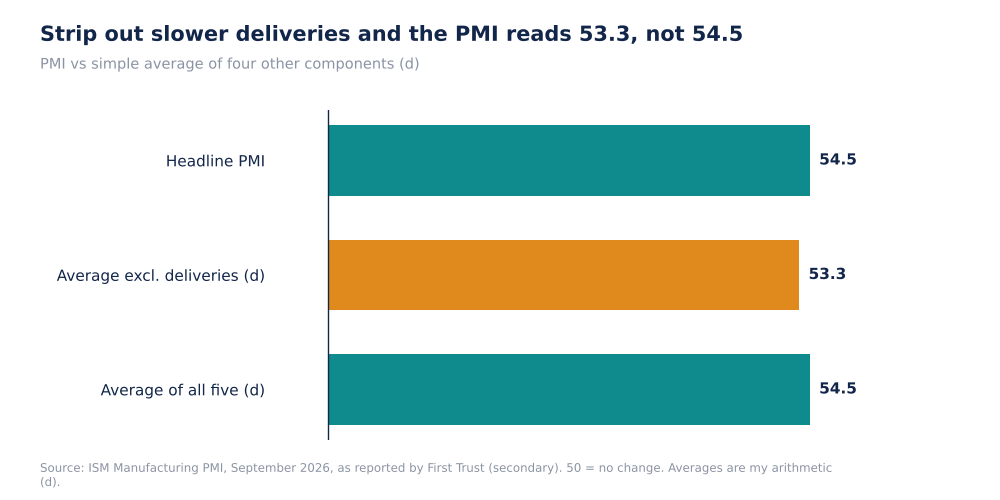
PMI Headline Vs Average Excluding Supplier Deliveries (Self-Made, d)
The ex-deliveries average of 53.3 is still well above 50, so the expansion does not depend on delays. The point is the size of the distortion: about 1.2 points (d). New orders (55.3) are well above inventories (48.6), a gap of 6.7 points (d), which would normally be read as a sign that production and shipments will draw down stock; the extract does not say whether firms are doing that.
Why it matters. The relevant question for earnings is whether volume growth is real. New orders and production both above 55 suggest it is, but I have no hard-data comparison (industrial production, shipments) in this extract to confirm.
Source: First Trust. Arithmetic is mine (d).
Forensic #3: The Prices Index
| Prices index | August | September | Change (d) |
|---|---|---|---|
| ISM Manufacturing prices | 71.1 | 77.9 | +6.8 |
| PMI | 54.6 | 54.5 | -0.1 |
| Gap, prices less PMI (d) | 16.5 | 23.4 | +6.9 |
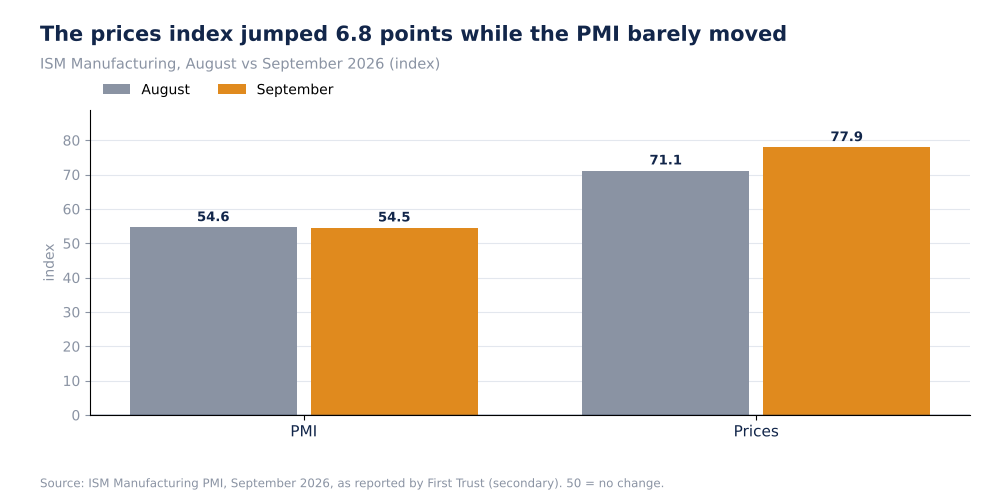
ISM Manufacturing PMI And Prices, August Vs September 2026 (Self-Made)
A prices index of 77.9 means far more respondents reported paying higher prices than lower ones. Respondents named steel and aluminum, tariffs, and petroleum-linked costs tied to the Middle East conflict. That fits the energy move in the September CPI (energy +20.4% over twelve months, gasoline +34.2%, per Stocknote's Fed article). The prices index measures input costs paid by factories, and the extract does not show whether they are passing them on.
Why it matters. When input prices rise this fast while the PMI is flat, margins at manufacturers with weak pricing power are the first place to look. The pattern also adds to the case for the Fed to keep rates high, which Stocknote's term-premium article discusses.
Sources: First Trust; BLS CPI. Differences are my arithmetic (d).
Forensic #4: Jobs, Orders And Exports
| Indicator | Reading | Comment |
|---|---|---|
| ISM employment index | 52.7 | Above 50, so more respondents report hiring than cutting |
| BLS payrolls, September | +29K | Total economy; unemployment 4.2% |
| Export orders | 50.9 | Barely above neutral |
| Backlog of orders | 56.4 | Above 50; orders waiting to be filled are rising |
The employment index at 52.7 is positive but is the lowest of the headline components that are above 50, and economy-wide payrolls rose only 29,000 in September (BLS). Export orders at 50.9 are close to neutral, so the strength in new orders (55.3) appears to be domestic. A backlog of 56.4 may be consistent with the delivery delays, with orders arriving faster than they are being filled, but the extract does not confirm the link.
Why it matters. Manufacturing is a small share of employment, so a good ISM employment reading does not offset weak total payrolls. Investors in industrial companies should treat the strength in orders as domestic and price-driven until the export index improves.
Sources: First Trust; BLS Employment Situation.
Valuation Snapshot
This is a macro article, so no single valuation applies. The manufacturing variables are:
| Measure | Latest |
|---|---|
| PMI | 54.5 |
| Prices index | 77.9 |
| Average excluding deliveries (d) | 53.3 |
| Months above 50 | 9 (consecutive) |
| Next release (October data) | November 3, 2026 |
What has to be true. For the expansion to be margin-positive, selling prices or volumes have to rise faster than input costs. The prices index rose 6.8 points in a month while the PMI fell 0.1.
Risks: What Would Break The Thesis
- Secondary source. The figures are from First Trust's summary, not the ISM report.
- Diffusion indexes. They show direction, not magnitude.
- Survey data. Responses are opinions of purchasing managers and can reverse in a month.
- Missing comparisons. August values for most components are not in my extract.
- Distortion. The deliveries effect would fade if bottlenecks eased, lowering the PMI without any weakening in demand.
The reading would be wrong if October shows the prices index falling back while new orders hold above 55.
What To Watch Next
- The October ISM report, due November 3, 2026.
- The prices index against 77.9.
- New orders and production against 55.3 and 56.7.
- Supplier deliveries against 59.0.
- Industrial production and shipments, to confirm the survey.
- Manufacturers' commentary on pricing and margins in earnings calls.

Sandeep Gupta
Independent equity research analyst publishing forensic theses on US-listed stocks. MBA, Politecnico di Milano School of Management (Milan, Italy).
Get new research in your inbox
Subscribe to receive forensic equity research the moment it's published. Free, no spam.
Discussion
Be the first to comment.