
Investment Thesis
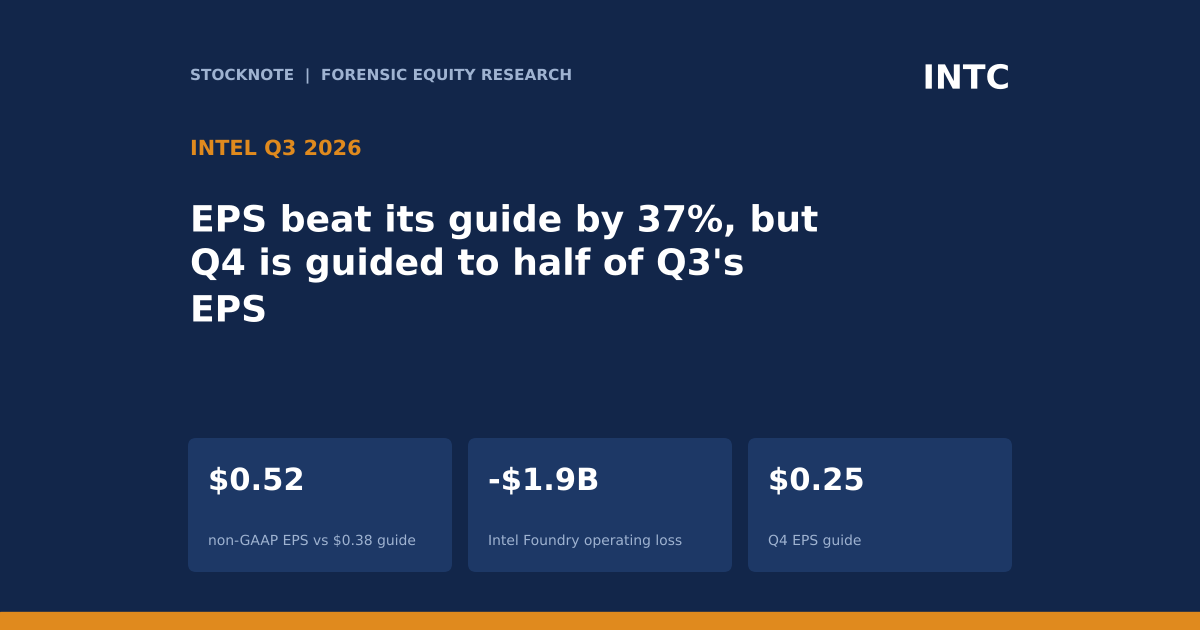
Intel reported third-quarter revenue of $16.5B and non-GAAP EPS of $0.52 against a guide of $0.38, with data-center revenue up nearly 80% from a year earlier. The same call guided fourth-quarter EPS to $0.25, gross margin to 38% from 44.1%, and client revenue down more than 20% sequentially, while the foundry segment lost $1.9B and drew only $411M of external revenue.
- Beat. Non-GAAP EPS was $0.52 against $0.38 guided, and non-GAAP gross margin was 44.1%, about 200 basis points above both Q2 and guidance. Revenue was $16.5B. About $0.01 of EPS came from interest income on the equity offering.
- Data center. DCAI revenue was $7.3B, up 17% sequentially and nearly 80% year over year, with operating profit of $3.0B (42% of revenue).
- Client. CCPG revenue was $8.1B, down 9% sequentially and 5% year over year, with operating profit of $2.3B (28%). Management expects the 2026 PC market to fall about 12% in units and second-half units to fall more than 20%.
- Foundry. Intel Foundry revenue was $6.7B (+16% sequentially) with an operating loss of $1.9B, $236M better than Q2. External foundry revenue was $411M, or about 6% of segment revenue (d).
- Q4 guide. Revenue of $15.0B to $16.0B (midpoint $15.5B), non-GAAP gross margin 38%, non-GAAP EPS $0.25, DCAI up mid-teens sequentially, CCPG down more than 20% sequentially.
- Balance sheet. Cash and short-term investments were about $54B after a $23B equity offering in early August. The revolver was raised to $15B from $10B. Operating cash flow was $5.1B and 2026 gross capex is $20B.
- This article contains no price target or rating. Every figure comes from the executives' spoken remarks on the Q3 call or a named source, and anything I calculated is marked (d).
Bottom line. Intel's Q3 shows two businesses moving in opposite directions: a data-center franchise growing close to 80% at 42% margins, and a foundry still losing $1.9B on little external revenue. TradingView shows a one-day fall of about 29%, which fits the Q4 guide of $0.25 of EPS against $0.52 in Q3. The market focused on what comes next, not on the beat.
Source: Intel Q3 2026 earnings call transcript, Motley Fool, Oct 30, 2026.
Q3 2026 At A Glance
A large beat against guidance, set against a guide that cuts EPS roughly in half.
| Metric (Q3 2026) | Result | Comparison |
|---|---|---|
| Revenue | $16.5B | Q4 guide $15.0B to $16.0B |
| Non-GAAP gross margin | 44.1% | About 200 bp above Q2 and guidance; Q4 guide 38% |
| Non-GAAP EPS | $0.52 | $0.38 guided; Q4 guide $0.25 |
| Operating cash flow | $5.1B | n/a |
| Cash and short-term investments | about $54B | After $23B equity offering |
| DCAI revenue / operating profit | $7.3B / $3.0B | +17% sequentially, nearly +80% year over year |
| CCPG revenue / operating profit | $8.1B / $2.3B | -9% sequentially, -5% year over year |
| Intel Foundry revenue / operating loss | $6.7B / -$1.9B | +16% sequentially; loss $236M better than Q2 |
| External foundry revenue | $411M | +$118M sequentially |
Total year-over-year revenue growth was not spoken on the call, so I show none. The page summary lists 21%, but I excluded it. Source: Intel Q3 2026 call transcript.
What The Market Believes vs. What The Data Actually Shows
| Belief | What the call shows |
|---|---|
| Intel's turnaround is visible in the numbers | Q3 EPS beat guidance by $0.14, but Q4 EPS is guided to $0.25, half of Q3's $0.52. |
| Client PCs are stable | CCPG revenue fell 9% sequentially, and the Q4 guide is a fall of more than 20% sequentially. |
| Foundry is scaling | External foundry revenue was $411M against $6.7B of segment revenue. |
| Data center is the growth engine | DCAI revenue grew nearly 80% year over year and is guided up mid-teens sequentially in Q4. |
| The balance sheet is repaired | About $54B of cash, but a $23B equity offering and a share count of 5.44B diluted shares in Q4. |
The only expectation figure on the call was Intel's own guidance of $0.38, so I make no comparison to analyst consensus.
A quick read of Q3 suggests a turnaround: a 37% EPS beat against guidance, gross margin 200 basis points above plan and record data-center growth. The same call shows why investors did not rest on it: the beat came with a guide that cuts EPS by about half and gross margin by about six points.
Forensic #1: Segment Revenue Adds To $22.1B, Reported Revenue Is $16.5B
The three segment figures spoken on the call sum to $5.6B more than reported revenue (d).
| Segment | Q3 2026 revenue |
|---|---|
| DCAI | $7.3B |
| CCPG | $8.1B |
| Intel Foundry | $6.7B |
| Sum of three segments (d) | $22.1B |
| Reported revenue | $16.5B |
| Difference (d) | $5.6B |
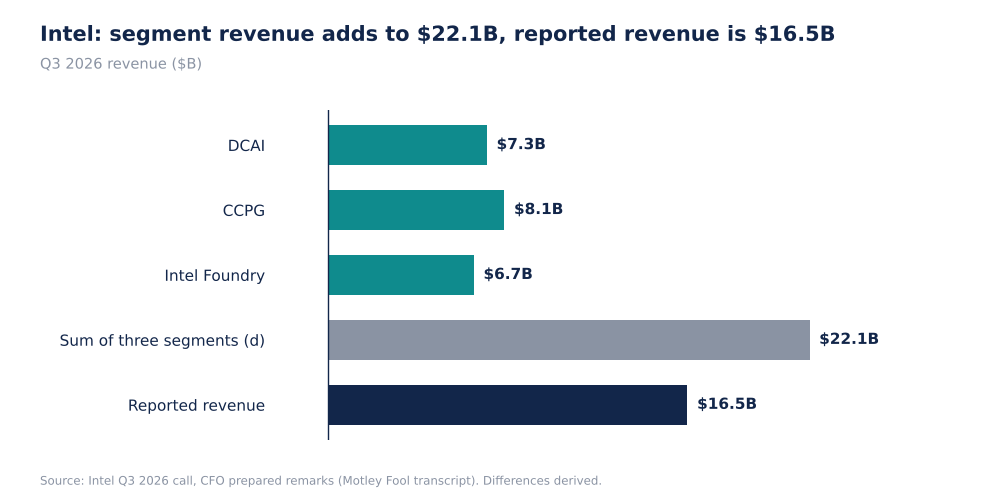
Intel Q3 2026 Segment Revenue vs Reported Revenue, $B (Self-Made)
The call does not explain the difference. It is consistent with foundry revenue that is mostly sales to Intel's own product segments being eliminated on consolidation, but I did not read the filing and do not assert that. External foundry revenue of $411M is about 6% of the foundry segment (d).
Why it matters. If most foundry revenue is internal, the foundry's reported revenue is a transfer between Intel's own segments, not evidence of outside demand. The only measure of outside demand is the $411M of external revenue, about 2.5% of company revenue (d). Customers committing to Intel's process nodes is the evidence investors need, and the call's figure shows that it is still early.
Source: Intel Q3 2026 call transcript.
Forensic #2: Two Profitable Segments Carry A $1.9B Foundry Loss
| Segment | Operating profit (loss) | Margin |
|---|---|---|
| DCAI | $3.0B | 42% |
| CCPG | $2.3B | 28% |
| Intel Foundry | -$1.9B | n/a |
| Net of three (d) | $3.4B | n/a |
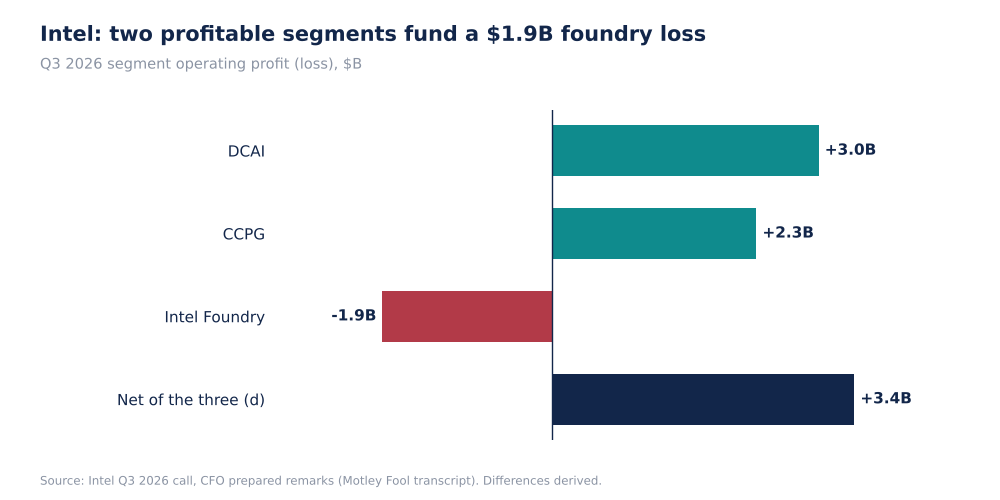
Intel Q3 2026 Segment Operating Profit (Loss), $B (Self-Made)
The foundry loss improved by $236M from Q2. DCAI operating profit rose about $600M sequentially. The foundry loss equals 36% of the profit of the other two segments (d), and the one segment that is shrinking sequentially, CCPG, earns 28% margins.
Why it matters. The two profitable segments earn $5.3B a quarter and fund a $1.9B foundry loss and a $20B capex plan. DCAI alone earns $3.0B, so a slowdown there would remove the main source of funding. The sequential decline in CCPG, and the more than 20% decline guided for Q4, shift the weight further onto DCAI.
Source: Intel Q3 2026 call transcript.
Forensic #3: The Q4 Guide Halves EPS And Cuts Gross Margin By About Six Points
| Metric | Q3 2026 actual | Q4 2026 guide | Change (d) |
|---|---|---|---|
| Revenue | $16.5B | $15.5B midpoint ($15.0B to $16.0B) | -6.1% |
| Non-GAAP gross margin | 44.1% | 38% | -6.1 pts |
| Non-GAAP EPS | $0.52 | $0.25 | -51.9% |
| Non-GAAP operating expenses | not spoken | $4.4B | n/a |
| Tax rate | not spoken | 11% | n/a |
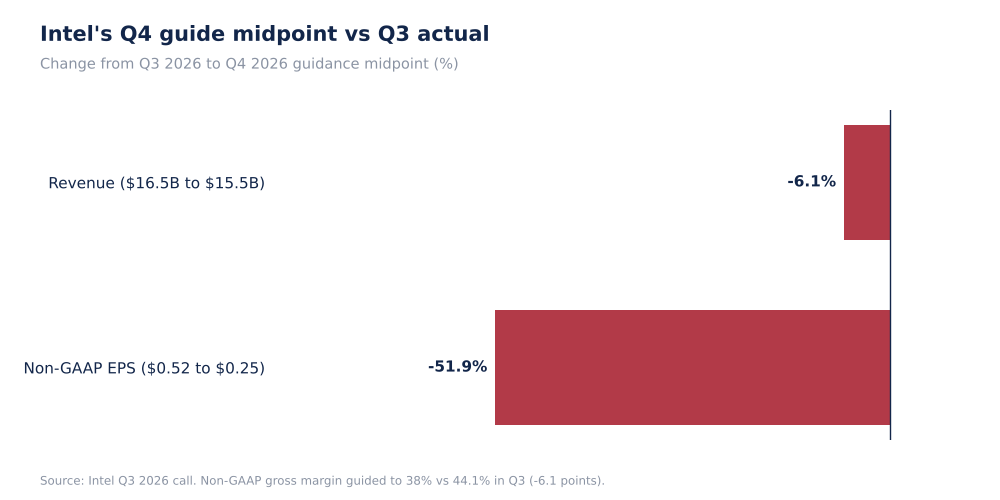
Intel Q4 2026 Guidance Midpoint vs Q3 2026 Actual (Self-Made)
Management named a Fab 28 impact of about $300M of revenue and 200 basis points of gross margin in Q4. That explains part of the margin step down but not the full six points, and the call does not break down the rest. Full-year 2026 non-GAAP operating expenses are about $16.3B.
Why it matters. The guide halves EPS while revenue falls only about 6%, so the decline is in margin, not volume. A gross margin of 38% against 44.1% costs about $0.9B of quarterly gross profit at $15.5B of revenue (d), which is large against guided operating expenses of $4.4B. Management attributes about 200 basis points to Fab 28, and the call does not itemise the other four or so points.
Source: Intel Q3 2026 call transcript.
Forensic #4: The Capital Raised And What Is Being Spent
| Item | Figure |
|---|---|
| Equity offering (completed early August) | $23B |
| Cash and short-term investments | about $54B |
| Revolver capacity | $15B (from $10B) |
| Operating cash flow, Q3 | $5.1B |
| Gross capex, 2026 | $20B |
| Q4 diluted share count (guide) | 5.44B |
| Noncontrolling interest | about $250M in Q4; about $1.1B in each of 2027 and 2028 |
Free cash flow and total debt were not stated in the prepared remarks, so I cannot give them. Firm equipment purchase orders rose nearly 40% sequentially, and management said 18A cost is down about 40% since Q1.
Why it matters. A $23B equity raise and about $54B of cash give Intel time, and the cash is about 15% of market cap (d). But part of the funding came from issuing shares, which is already in the 5.44B share count, so per-share earnings have to carry the dilution. The balance sheet reduces the risk of a funding squeeze but does not itself create earnings.
Source: Intel Q3 2026 call transcript.
Valuation Snapshot
TradingView shows Intel at $65.76, down 28.6% on the day, which fits the Q4 guide that halves EPS. A community post on the same page says it closed on Oct 30 at $65.12, down 29.3%. I did not use the post in any calculation. Market cap is about $347.6B and the all-time high was $142.35 on Jun 30, 2026.
| Measure | Figure |
|---|---|
| Share price (TradingView) | $65.76 |
| Day change (TradingView) | -28.6% |
| Market cap (TradingView) | about $347.6B |
| Below the Jun 30 all-time high of $142.35 (d) | about 54% |
| Year to date (TradingView) | +74.1% |
| Q4 diluted shares (guide) x price (d) | about $358B, close to the TradingView market cap |
| Price / annualised Q3 non-GAAP EPS of $2.08 (d) | about 31.6x |
| Price / annualised Q4 EPS guide of $1.00 (d) | about 65.8x |
| Cash and short-term investments as % of market cap (d) | about 15% |
| Trailing GAAP EPS (TradingView) | -$2.38 |
The market reacted to the Q4 guide, not the Q3 beat. Even after a 29% fall, the price is about 66 times the annualised Q4 EPS guide, so the valuation depends on the data-center growth continuing while foundry losses narrow.
What has to be true. At about 66 times the Q4 EPS guide, the market is not valuing Intel on current earnings. It is valuing a recovery in foundry economics and sustained DCAI growth. The measurable milestones are external foundry revenue, the foundry loss narrowing from $1.9B and gross margin recovering toward the 44.1% of Q3.
Risks: What Would Break The Thesis
- PC weakness. The call expects PC units down about 12% in 2026 and about 10% in 2027.
- Foundry execution. A $1.9B quarterly loss with 6% external revenue leaves little room for slippage.
- Margin. A guide of 38% against 44.1% in Q3 shows how volatile it is.
- Dilution. The $23B equity raise is already in the share count.
- Data limits. I did not read the release or filings.
The guide itself is the key risk: management set Q4 EPS at $0.25 and the shares reacted sharply. Other risks sit in PC demand, where management expects unit declines of about 12% in 2026, and in foundry execution.
What To Watch Next
- Q4 non-GAAP EPS against the $0.25 guide and gross margin against 38%.
- External foundry revenue against $411M.
- The foundry operating loss against $1.9B.
- DCAI growth against the mid-teens sequential guide.
- Free cash flow and gross capex against $20B.

Sandeep Gupta
Independent equity research analyst publishing forensic theses on US-listed stocks. MBA, Politecnico di Milano School of Management (Milan, Italy).
Get new research in your inbox
Subscribe to receive forensic equity research the moment it's published. Free, no spam.
Discussion
Be the first to comment.