
Investment Thesis
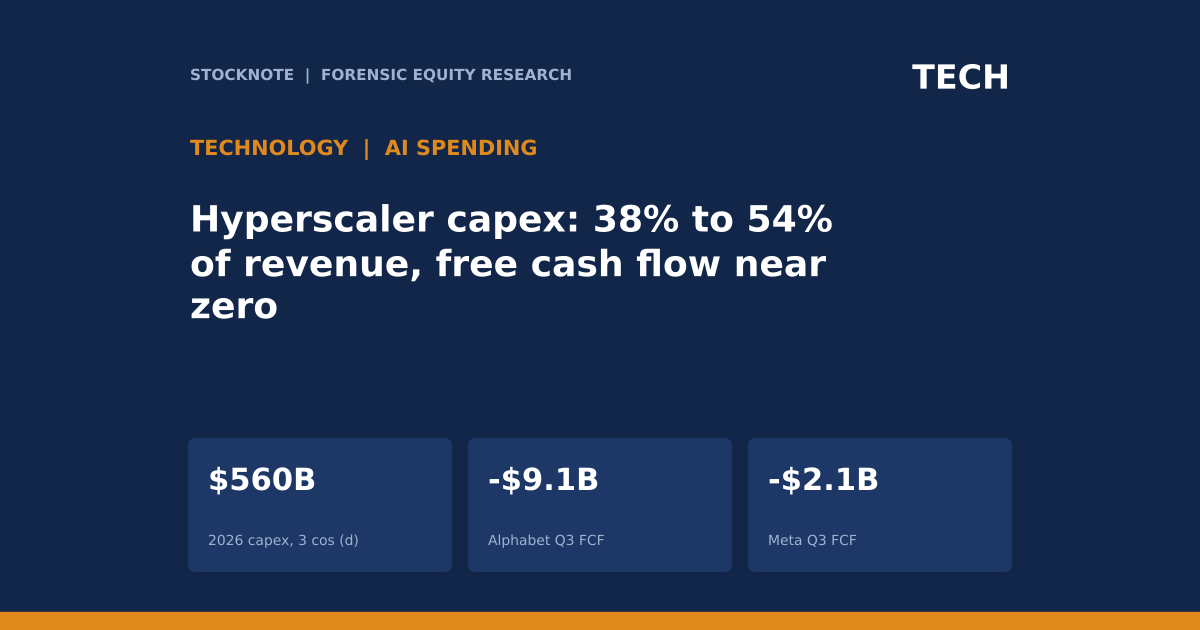
Four of the largest US technology companies reported third-quarter 2026 figures in which capital expenditure absorbed between 37.6% and 54.0% of revenue (d). Amazon spent $75.9B on capex against $28.1B of operating income, Alphabet $51.4B against $42.3B of operating cash flow, Meta $34.9B against $32.8B, and Microsoft $39.4B in its fiscal first quarter, according to a secondary summary. Free cash flow was negative at Alphabet (-$9.1B) and Meta (-$2.1B). This article sets out a framework for reading capital spending of this size: intensity, funding, the depreciation that follows, and the revenue needed to earn a return.
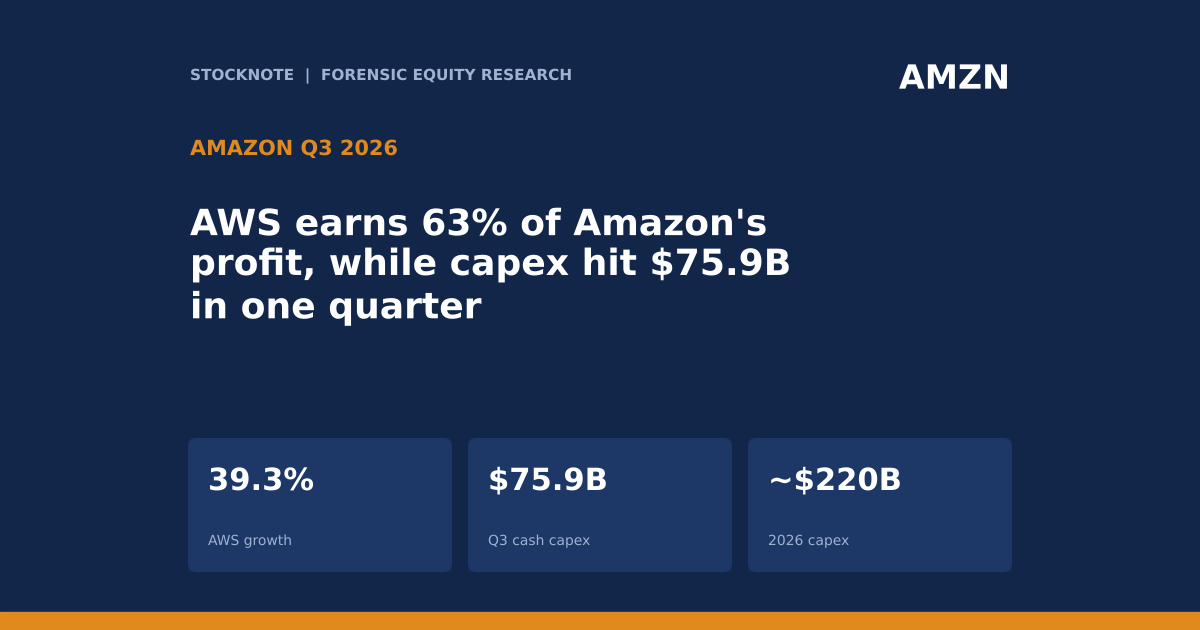
- Amazon. Q3 revenue $201.9B, operating income $28.1B, cash capex $75.9B; 2026 capex guided to about $220B; AWS revenue $46.0B (+39.3%), backlog $578B. The call did not give free cash flow.
- Alphabet. Revenue $127.6B, operating income $40.6B, operating cash flow $42.3B (after a $5.2B EC fine payment), capex $51.4B, free cash flow -$9.1B. 2026 capex $195B to $205B, and the CFO said it will rise significantly in 2027. Future purchase commitments $924B.
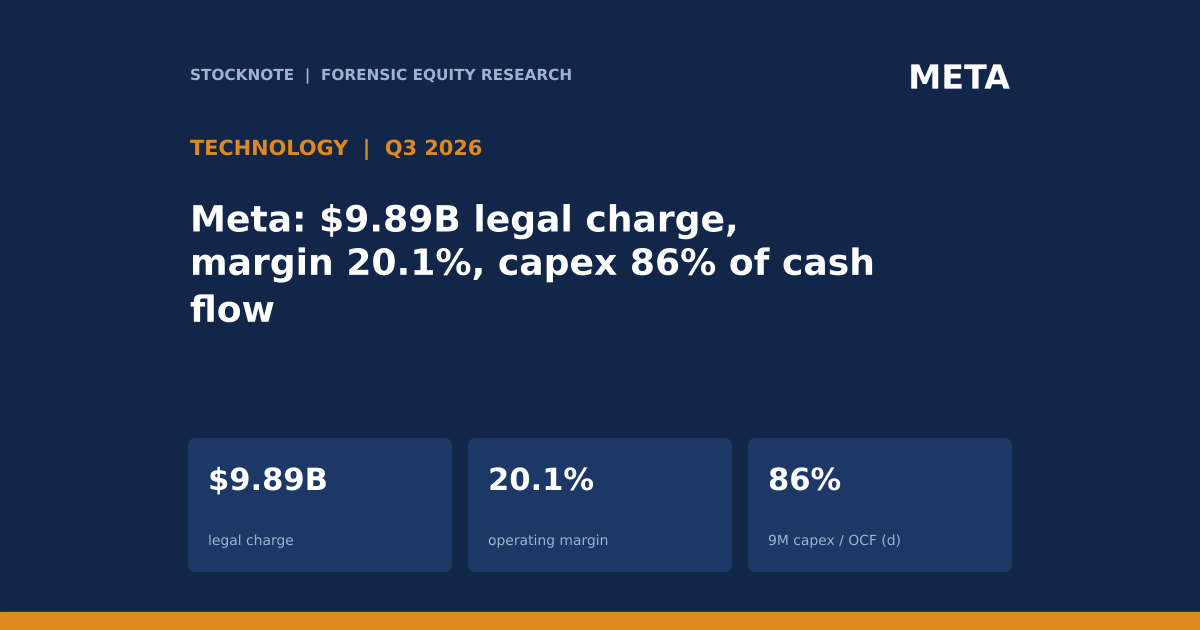
- Meta. Revenue $64.6B (+26%), operating income $13.0B including a $9.89B legal charge ($22.9B without it), operating cash flow $32.8B, capex including finance leases $34.9B, free cash flow -$2.1B, no buybacks in the quarter. 2026 capex guided to $135B to $145B.
- Microsoft. FQ1 2027 revenue $92.3B (+19%), Azure +48%, capex $39.4B (nearly double a year earlier), free cash flow $18.6B (secondary summary).
- This article contains no rating, price target or investment advice. Every figure comes from a named source and anything I calculated is marked (d).
Bottom line. The spending is financed today from operating cash flow plus cash balances, with Alphabet and Meta already running slightly cash-negative after capex. What the data cannot show yet is the return. The revenue evidence is strong (Azure +48%, AWS +39.3%, Google Cloud +103%), but the cost side arrives later through depreciation. A simple illustration in this article, based on my own assumptions, shows that depreciation on 2026 capex alone could take 29% to 34% of the three companies' current operating income run rate (d).
Sources: Stocknote's Amazon and Alphabet Q3 2026 articles (company calls); Meta Q3 2026 8-K exhibit; AI Weekly summary of Microsoft FQ1 2027.
Q3 2026 At A Glance
| Company | Revenue | Operating income | Capex | Capex / revenue (d) | Capex / operating income (d) |
|---|---|---|---|---|---|
| Amazon | $201.9B | $28.1B | $75.9B | 37.6% | 2.7x |
| Alphabet | $127.6B | $40.6B | $51.4B | 40.3% | 1.3x |
| Meta | $64.6B | $13.0B ($22.9B ex-charge) | $34.9B | 54.0% | 2.7x (1.5x ex-charge) |
| Microsoft (FQ1) | $92.3B | not retrieved | $39.4B | 42.7% | n/a |
Sources: company results as cited above; ratios are my arithmetic (d). Capex definitions differ: Amazon cash capex, Alphabet capex, Meta includes principal payments on finance leases; Microsoft's definition was not confirmed.
What The Market Believes vs. What The Data Actually Shows
| Belief | What the data show |
|---|---|
| Big tech funds AI spending easily from profits | Operating income covers capex at Alphabet (1.3x capex/OI, d) but not at Amazon or Meta (2.7x each, d); Alphabet and Meta had negative free cash flow in the quarter. |
| Demand justifies the spending | Cloud growth is high (AWS +39.3%, Azure +48%, Google Cloud +103%), and backlogs are large (AWS $578B), but the release data say nothing about returns on the capital. |
| Capex has peaked | Alphabet's CFO said 2027 capex will rise significantly; Amazon's Q3 capex alone ($75.9B) is 34.5% of its roughly $220B 2026 guide (d). |
| Costs are visible now | Capital spending reaches the income statement through depreciation, which lags. Meta's operating margin already fell to 20% from 40% (including the legal charge; 35% without it, d). |
The Meta margin comparison needs care: the 20% includes the $9.89B charge, and without it operating income of $22.88B on $64.6B of revenue is 35.4% (d). The margin decline is mostly the legal item and partly higher costs (costs and expenses rose 68%, which includes the charge).
Forensic #1: Capex Intensity
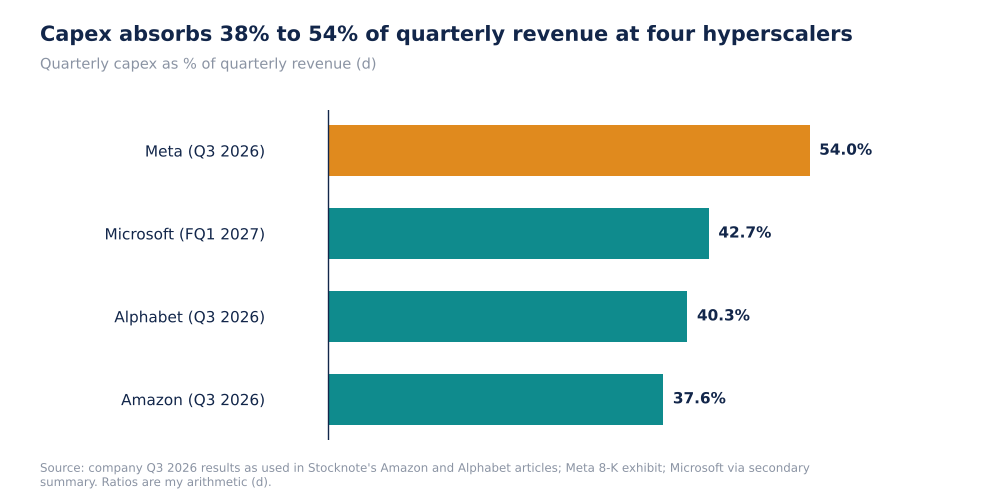
Capex As % Of Revenue, Latest Quarter (Self-Made, d)
Spending close to 40% of revenue on capital goods is a very different business model from asset-light software or advertising. In the data here, the figure is 37.6% at Amazon (whose retail business dilutes the ratio, so AWS is higher, d: $75.9B is 1.65 times AWS revenue of $46.0B), 40.3% at Alphabet, 42.7% at Microsoft and 54.0% at Meta. Meta has no cloud business to resell the capacity to external customers in the data I read, so the return has to come through advertising and products.
Why it matters. Capital intensity changes how to value these companies. A business with 10% capex to revenue converts most of its operating profit to cash; at 40% to 54% the free cash flow depends on how much of the capex is growth capital that can be reduced.
Sources: company results (see above). Ratios are my arithmetic (d).
Forensic #2: Funding The Spending
| Item (Q3 2026) | Alphabet | Meta |
|---|---|---|
| Operating cash flow | $42.3B | $32.8B |
| Capex | $51.4B | $34.9B |
| Free cash flow | -$9.1B | -$2.1B |
| Capex / operating cash flow (d) | 1.22x | 1.06x |
| Cash and marketable securities | $265.1B (incl. $90.4B equity securities) | $82.45B |
| Long-term debt | $125.1B | $80.9B |
| Shareholder returns | Dividend $0.22/share per quarter | $1.36B dividends; no buybacks (vs $3.3B a year earlier) |
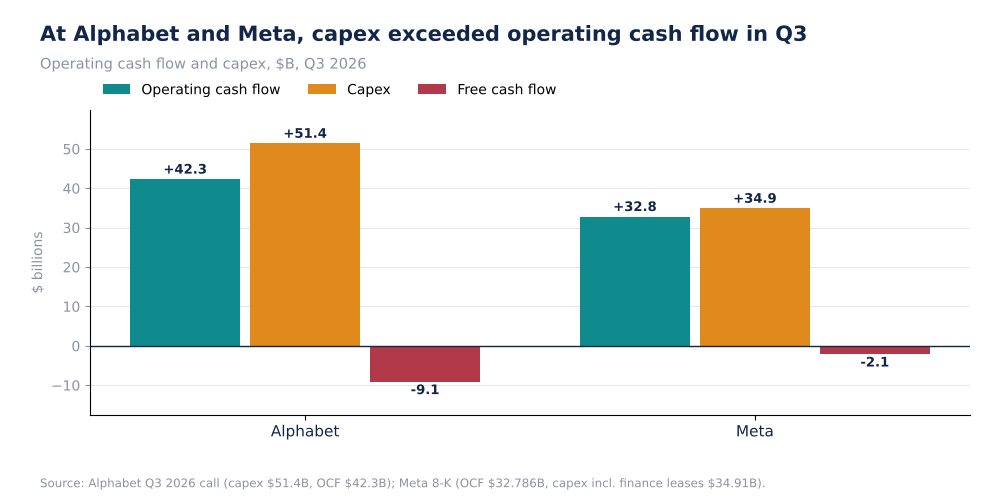
Operating Cash Flow, Capex And Free Cash Flow, $B (Self-Made)
Alphabet's free cash flow of -$9.1B includes the $5.2B EC fine, so excluding it the figure is about -$3.9B (d). Trailing twelve-month free cash flow was $19.7B on $179.6B of operating cash flow, a conversion of 11% (d, as stated in the Alphabet article). Meta's free cash flow of -$2.1B was achieved while it stopped buying back stock (zero in Q3 against $3.3B a year earlier) and its cash still fell, to $82.45B from $90.26B at June 30, while long-term debt fell to $80.9B from $83.7B (d: a $7.8B fall in cash and a $2.7B fall in debt).
Why it matters. The first sign that capital spending is competing with shareholder returns is already in the Meta data: no repurchases in Q3. Balance-sheet strength is large (Alphabet holds $265.1B of cash and securities), but $90.4B of that is equity securities, which can fall in value: Alphabet reported an $8.2B other expense in the quarter, mainly an unrealised loss on its SpaceX investment.
Sources: Meta 8-K exhibit; Stocknote's Alphabet Q3 article. Derived items marked (d).
Forensic #3: The Depreciation Lag
| Assumption (mine, not company data) | 5-year life | 6-year life |
|---|---|---|
| 2026 capex, Amazon + Alphabet + Meta (guidance midpoints) | $560B | $560B |
| Annual depreciation if straight-line (d) | $112B | $93B |
| Q3 operating income, three companies (d: 28.1 + 40.6 + 13.0, Meta after its $9.9B charge) | $81.7B | $81.7B |
| Annualised (Q3 x 4) (d) | $327B | $327B |
| Depreciation as % of annualised operating income (d) | 34% | 29% |
I use straight-line depreciation over five or six years purely as an illustration; companies' actual lives differ by asset (servers, buildings and land are depreciated differently) and part of capex is for assets not yet in service, so depreciation starts later. The point is the order of magnitude: a year of capex at the guided level would add depreciation equal to roughly 29% to 34% of the three companies' annualised third-quarter operating income (d), on top of the depreciation already in their cost base. Meta's data show this is already visible: costs and expenses were up 68% (including the legal charge) against revenue up 26%.
Why it matters. Today's operating income is flattered relative to a steady state in which the new assets are in service. For operating margins to hold, revenue from the new capacity has to grow at least as fast as the depreciation. This is the central test over the next several quarters, and the disclosed backlogs (AWS $578B, Alphabet purchase commitments $924B) are the closest evidence that the revenue exists.
Sources: Stocknote's Amazon and Alphabet articles; Meta 8-K exhibit. The depreciation table is illustrative arithmetic and is not a forecast.
Forensic #4: Total Commitments
| Company | 2026 capex guidance | Basis |
|---|---|---|
| Amazon | about $220B | CEO guidance, cash capex |
| Alphabet | $195B to $205B | Unchanged; 2027 to rise significantly |
| Meta | $135B to $145B | Narrowed from $130B to $145B; includes finance leases |
| Three-company midpoint total (d) | about $560B | 220 + 200 + 140 |
| Microsoft (FY2027, June year-end) | $170B to $175B reported | Secondary sources; tied to a lease reclassification; not confirmed in Microsoft's release |
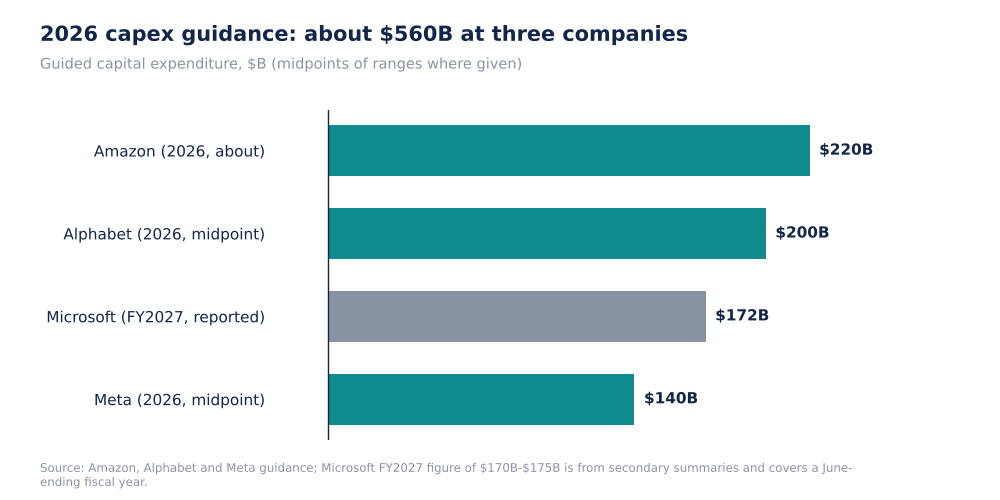
Guided Capital Expenditure, $B (Self-Made)
The sum of Amazon, Alphabet and Meta guidance, about $560B (d), compares with the quarterly figures: Alphabet's Q3 capex annualised is $205.6B (d), at the top of its range, and Meta's is $139.6B (d), inside its range. Amazon's Q3 is $75.9B; at $220B for the year the other three quarters together would average about $48B (d) if the guidance holds, which suggests that either Q3 was a peak or the guide will be revised, and the call material I read does not say which. Microsoft's figure of about $170B to $175B is for its fiscal 2027 and was reported by secondary sources as linked to a reclassification of finance leases to operating leases, so I do not add it to the total.
Why it matters. A spending programme of this size, concentrated in a handful of buyers, is the source of the equipment-investment surge (+20.9%) in the third-quarter GDP data and a large part of semiconductor earnings growth (+131%, FactSet). That makes the suppliers' growth dependent on the buyers' ability to keep funding it.
Sources: company guidance via Stocknote's articles and the Meta 8-K; AI Weekly, on Microsoft. Totals are my arithmetic (d).
Valuation Snapshot
This is a sector article, so no single multiple applies. The metrics to track are the ratios shown below, which I calculated from the quarterly data.
| Measure | Amazon | Alphabet | Meta | Microsoft |
|---|---|---|---|---|
| Capex / revenue (d) | 37.6% | 40.3% | 54.0% | 42.7% |
| Free cash flow, quarter | not given | -$9.1B | -$2.1B | $18.6B |
| Capex / OCF (d) | n/a | 1.22x | 1.06x | n/a |
| 2026 or FY27 capex guide | about $220B | $195B-$205B | $135B-$145B | $170B-$175B |
What has to be true. For spending at this scale to earn a return, cloud and advertising revenue growth must continue at rates close to current ones (AWS +39.3%, Azure +48%, Google Cloud +103%) for long enough to absorb the depreciation; free cash flow must turn positive again as capex growth slows; and the buyers must keep the funding capacity to continue without cutting returns to shareholders further.
Risks: What Would Break The Thesis
- Return risk. Capex is observed; returns are not. A slowdown in cloud growth would leave depreciation without revenue.
- Funding. Capex already exceeds operating cash flow at Alphabet and Meta.
- Mark-to-market. Alphabet holds $90.4B of equity securities, and an unrealised loss on one investment produced an $8.2B other expense in the quarter.
- Concentration. Equipment suppliers and GDP growth depend on a small group of buyers.
- Data limits. Amazon's free cash flow and Microsoft's operating income, depreciation and capex definition were not available to me; Microsoft figures are from a secondary summary and the Amazon and Alphabet figures come from the earnings calls.
The argument could be wrong if the revenue backlog converts faster than depreciation arrives, in which case margins would hold and free cash flow would recover quickly.
What To Watch Next
- Amazon's 10-Q for operating cash flow and free cash flow.
- 2027 capex guidance from Alphabet (above $195B to $205B), Amazon and Meta.
- Microsoft's fiscal 2027 guidance and capex definition.
- Depreciation growth against revenue growth in each company's next report.
- Meta's buyback activity after zero in Q3.
- Alphabet's free cash flow once the $5.2B EC payment drops out.

Sandeep Gupta
Independent equity research analyst publishing forensic theses on US-listed stocks. MBA, Politecnico di Milano School of Management (Milan, Italy).
Get new research in your inbox
Subscribe to receive forensic equity research the moment it's published. Free, no spam.
Discussion
Be the first to comment.