

Investment Thesis
Hubbell beat on adjusted EPS and raised its full-year guide, but just over half of the sales growth was bought, a $31M tariff refund is larger than the quarter's EPS beat, and interest costs and debt rose sharply after the $3.0B NSI deal.
- Earnings. Net sales were $1,872.5M (+24.6%). Adjusted EPS was $5.91 vs $5.17 (+14%), against $5.75 expected (TIKR). GAAP EPS was $4.94 vs $4.77 (+4%).
- Bought growth. Organic growth was +11.3% (+$169.3M) and acquisitions added +13.2% (+$198.8M). Acquisitions were 54% of the dollar increase (derived). On NSI's pro forma base, Q3 sales growth was +14.3% (derived).
- Tariff refund. The 10-Q says Hubbell received about $31M of IEEPA tariff refunds in Q3, booked as a reduction to cost of goods sold. The adjusted EPS reconciliation has no line for it, so it appears to sit inside adjusted EPS. At the 22.5% top of the adjusted tax guide, that is about $0.45 per share (derived), almost three times the $0.16 beat.
- Profit conversion. Adjusted operating income rose $118.4M (+33%), but adjusted net income rose only $37.7M (+14%). Net interest expense rose $44.4M to $58.0M, and a residual of about $36.8M went to tax and other items (derived).
- Balance sheet. Net debt rose from $1,729M to $4,665M in nine months (+170%). Goodwill and intangibles are now $7.5B against $4.1B of Hubbell shareholders' equity (derived).
- Guidance. Full-year adjusted EPS was raised to $20.40 to $20.60. It implies Q4 adjusted EPS of $5.03 to $5.23, 11% to 15% below Q3 (derived). Free cash flow must also jump about 56% from Q3 to reach the stated conversion target (derived).
- Stock. It closed at $459.40 on Oct 26 and traded about 5% to 6% lower on Oct 27 (secondary sources, close unconfirmed). On $20.50, the guidance midpoint, that is 22.4x before the drop and about 21.4x at $438 (derived).
- This article contains no price target or rating. Every figure comes from Hubbell's filings or a named source, and anything I calculated is marked.
Source: Hubbell Q3 2026 results, Exhibit 99.1 to Form 8-K, Oct 27, 2026.
Q3 2026 At A Glance
Sales grew 24.6% to $1.87B, adjusted operating income grew 33%, and GAAP net income attributable to Hubbell grew only 3%.
| Metric (quarter ended Sept 30) | Q3 2026 | Q3 2025 | Change |
|---|---|---|---|
| Net sales | $1,872.5M | $1,502.4M | +24.6% (organic +11.3%, acquisitions +13.2%) |
| Utility Solutions sales | $1,027.8M | $943.8M | +9% (organic +4.9%) |
| Electrical Solutions sales | $844.7M | $558.6M | +51% (organic +22.0%) |
| Operating income (GAAP) | $408.7M | $330.6M | +24% |
| Operating margin (GAAP) | 21.8% | 22.0% | -0.2 pts |
| Operating income (adjusted) | $476.8M | $358.4M | +33% |
| Operating margin (adjusted) | 25.5% | 23.9% | +1.6 pts |
| Interest expense, net | $58.0M | $13.6M | 4.3x (d) |
| Net income attributable to Hubbell (GAAP) | $262.5M | $255.5M | +3% |
| Diluted EPS (GAAP) | $4.94 | $4.77 | +4% |
| Adjusted net income | $314.3M | $276.6M | +14% |
| Diluted EPS (adjusted) | $5.91 | $5.17 | +14% |
| Adjusted EBITDA | $506.9M | $383.1M | +32% |
| Operating cash flow | $322.6M | $284.3M | +13% (d) |
| Capital expenditures | $42.2M | $30.5M | +38% (d) |
| Free cash flow | $280.4M | $253.8M | +10% (d) |
(d) = derived. Adjusted figures exclude acquisition-related amortization ($62.2M pre-tax vs $24.7M), transaction, integration and separation costs ($5.9M vs $3.1M) and their tax effects. Source: Hubbell Q3 2026 results, Exhibit 99.1.
What The Market Believes vs. What The Data Actually Shows
Hubbell beat the quarterly estimate by $0.16, yet the stock fell because the full-year raise only matched expectations and debt and interest costs jumped.
| Item | Result or guide | Comparison |
|---|---|---|
| Q3 adjusted EPS | $5.91 | $5.75 expected (TIKR), +$0.16 |
| 2026 adjusted EPS | $20.40 to $20.60 | Raised from $20.25 to $20.55 (TIKR); midpoint +$0.10; consensus $20.51 |
| 2026 GAAP EPS | $17.30 to $17.50 | Gap to adjusted guide is about $3.10 (derived) |
| 2026 total sales growth | 18% to 19% | Nine months: +17.2% (derived) |
| 2026 organic sales growth | 10% to 11% | Nine months: +9.9% |
| 2026 adjusted tax rate | 22.0% to 22.5% | Q3 implied rate is higher (see Forensic #3) |
| 2026 free cash flow | About 90% of adjusted net income | Nine months: 66% (derived) |
Price reaction: Hubbell closed at $459.40 on Oct 26. On Oct 27 it traded at $437.60 premarket, opened at $430.64 and was at $438.23 intraday, which is 4.6% to 6.3% below the prior close (derived). TIKR reports a decline of about 6%. I could not confirm the Oct 27 closing price.
TIKR attributes the drop to the small guidance raise after a $0.16 beat, Utility Solutions organic growth of only about 5% with Grid Automation down about 4%, and the rise in net debt and interest expense. The CEO called the meter weakness "a temporary component availability headwind". That is the company's explanation as reported by TIKR, and I could not check the call transcript directly.
Sources: Hubbell Exhibit 99.1; TIKR; MarketBeat and Investing.com quotes for the Oct 26 and Oct 27 prices.
Forensic #1: Just Over Half Of The Sales Growth Was Bought
Headline sales growth of 24.6% mixes real organic growth with the effect of buying NSI, Ventev, Nicor and DMC Power.
| Q3 2026 sales growth | Dollars | Percentage points |
|---|---|---|
| Organic | +$169.3M | +11.3 |
| Acquisitions | +$198.8M | +13.2 |
| Currency | n/a | +0.1 |
| Total reported | +$370.1M (d) | +24.6 |
Acquisitions were 198.8 / 370.1 = 54% of the dollar growth (derived). Source: Hubbell Exhibit 99.1.
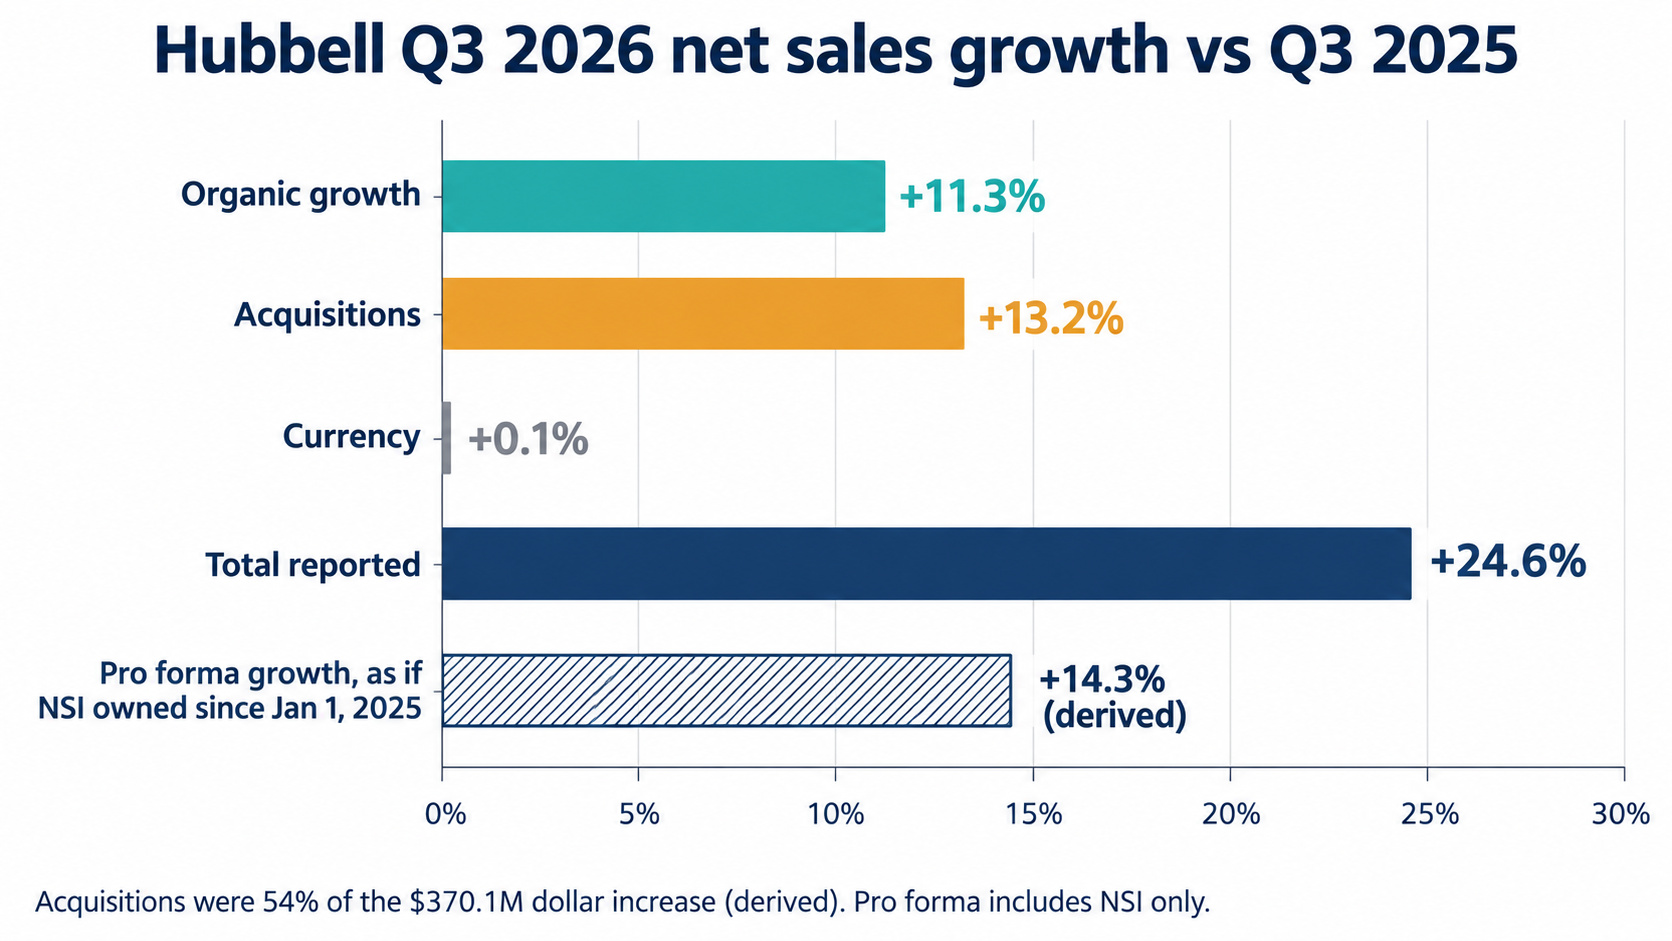
Q3 2026 Net Sales Growth Split Into Organic, Acquisition and Pro Forma Views (Self-Made)
The organic number is genuinely strong: +11.3% compares with +3.2% a year earlier. Electrical Solutions drove it, with organic growth of +22.0% and acquisitions adding another +29.1 points, for total segment growth of +51%. Utility Solutions grew +9% in total and only +4.9% organically. Within it, Grid Infrastructure grew about 13% and Grid Automation fell about 4%.
Hubbell's 10-Q gives a pro forma view as if NSI had been owned since January 1, 2025. On that base, Q3 2025 sales would have been $1,638.0M, so Q3 2026 growth was +14.3% (derived). For nine months, pro forma sales were $5,347.6M vs $4,729.2M, or +13.1% (derived). That pro forma base includes NSI only, so it still contains the other acquisitions.
NSI closed on June 9, 2026 for $3.0B net of cash acquired. Since closing, it has contributed about $197.9M of sales and $21.3M of operating income, a GAAP margin of about 10.8% (derived), which includes acquisition accounting. The 10-Q does not give NSI's Q3 figures separately. Hubbell recorded $1,303.9M of goodwill and $1,856.0M of intangibles on the deal, preliminary.
Sources: Hubbell Exhibit 99.1; Hubbell Form 10-Q, Note 2.
Forensic #2: A $31M Tariff Refund Is Larger Than The $0.16 Beat
The 10-Q discloses a one-time item that appears to be inside adjusted results.
- The Supreme Court ruled on IEEPA tariffs on Feb 20, 2026. U.S. Customs opened its refund system on Apr 20, 2026, and Hubbell filed claims.
- In Q3 Hubbell received about $31M of refunds, recorded as a reduction to cost of goods sold. The company uses a gain contingency model, so nothing was booked until it was realised or realisable.
- The adjusted EPS reconciliation in the release lists only acquisition amortization, transaction and integration costs, and tax effects. There is no refund line. My reading is that the $31M is inside adjusted operating income, but the release does not say so.
- The 10-Q does not state the amount still unclaimed or still receivable, and the release gives no refund amount or timing.
| Adjusted Q3 2026 measure | As reported | Excluding $31M refund (d) |
|---|---|---|
| Adjusted operating income | $476.8M | $445.8M |
| Adjusted operating margin | 25.5% | 23.8% (Q3 2025: 23.9%) |
| Refund as share of adjusted operating income | 6.5% | n/a |
| Adjusted EPS | $5.91 | about $5.46 (after tax at 22.5%, $0.45 per share) |
| Adjusted EPS growth | +14.3% | about +5.6% |
| Versus $5.75 expected | +$0.16 | about -$0.29 |
(d) = derived: $31M x (1 - 22.5%) / 53.18M adjusted diluted shares = $0.45. This assumes the refund is inside adjusted results, and I do not know whether the $5.75 estimate included refunds. Both release segments also report a net tariff benefit in Q3, with no amount given.
On that arithmetic, adjusted operating margin was flat year over year excluding the refund, so the 160 basis point expansion would come from the one-time item. The segment data support this only partly: Electrical Solutions adjusted margin rose to 24.8% from 20.8%, while Utility Solutions rose only to 26.0% from 25.7%. The release does not say which segment received the refund, so I could not allocate it.
Sources: Hubbell Form 10-Q, Note 1; Hubbell Exhibit 99.1; TIKR for the $5.75 estimate.
Forensic #3: Operating Income Rose $118M, Adjusted Net Income Rose $38M
Higher interest and a higher implied tax rate took back about two thirds of the operating gain.
| Bridge, adjusted | Amount |
|---|---|
| Q3 2025 adjusted net income | $276.6M |
| Higher adjusted operating income | +$118.4M |
| Higher net interest expense ($58.0M vs $13.6M) | -$44.4M |
| Lower other expense, net ($5.4M vs $5.9M) | +$0.5M |
| Tax, noncontrolling interest and other (residual) | -$36.8M (d) |
| Q3 2026 adjusted net income | $314.3M |
(d) = derived as the amount needed to close the bridge. Source: Hubbell Exhibit 99.1; my arithmetic.
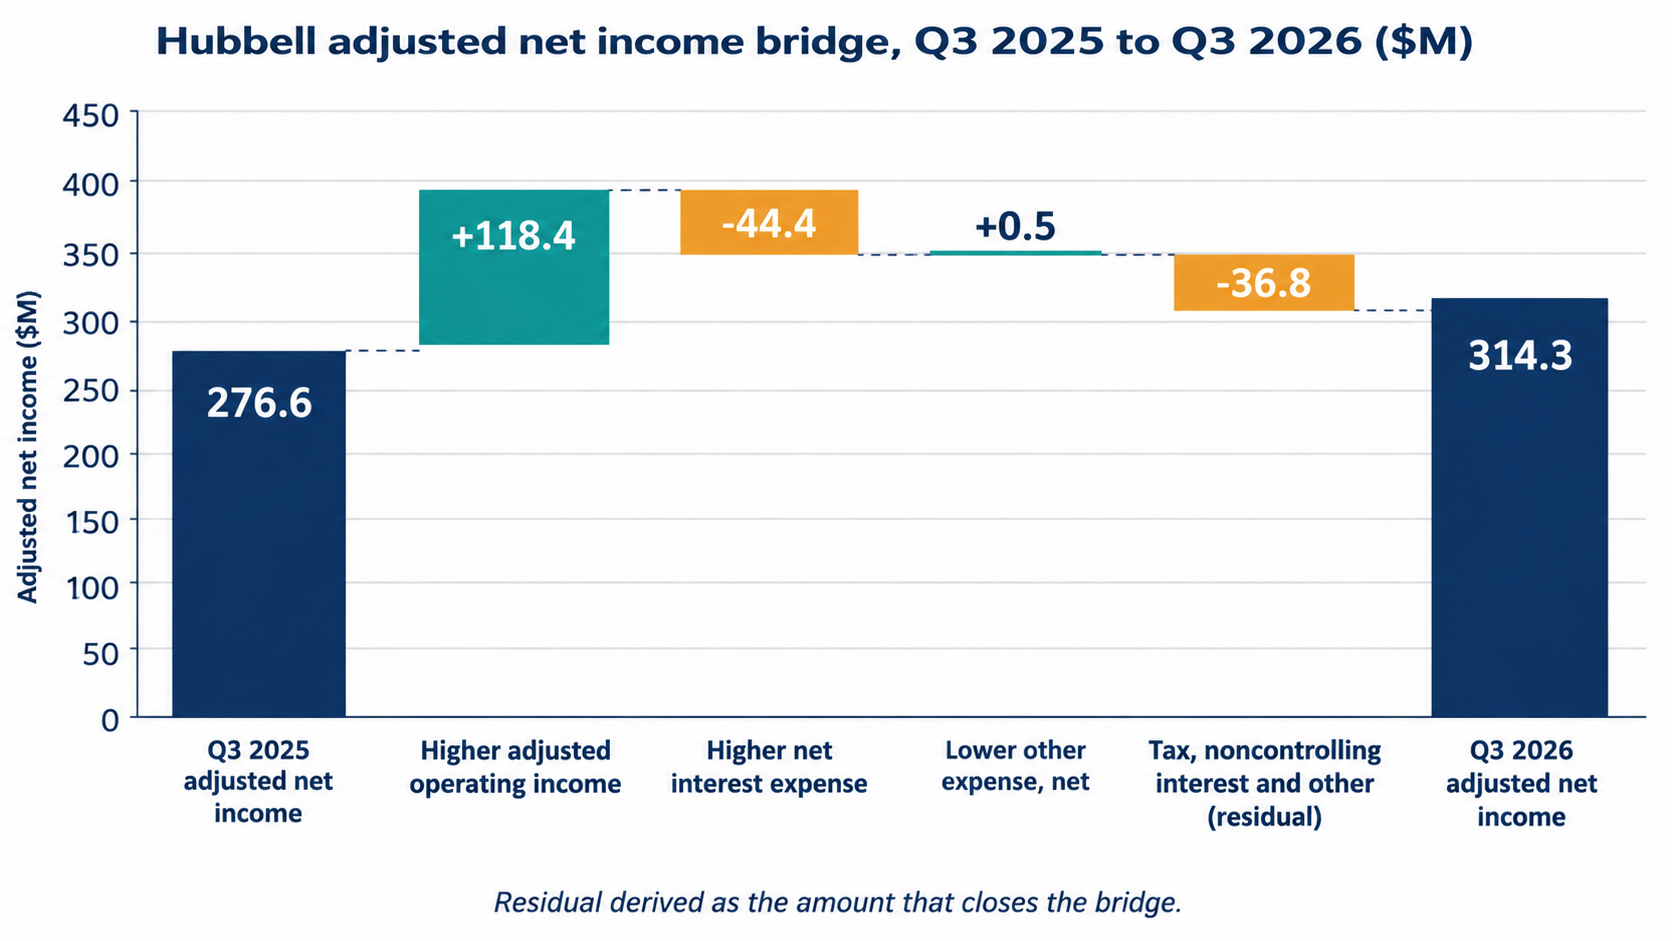
Bridge From Q3 2025 To Q3 2026 Adjusted Net Income, $M (Self-Made)
Electrical Solutions produced $93.4M of the $118.4M increase in adjusted operating income, or 79%, and Utility Solutions $25.0M (derived). Interest expense was 12.2% of adjusted operating income, up from 3.8%. Adjusted operating income covered net interest 8.2 times, down from 26.4 times (derived). At the Q3 rate, annual interest is about $232M (derived), against $119.1M for the nine months.
The bridge residual implies a tax and other burden of about 24.0% of adjusted pre-tax income, against 18.4% a year earlier (derived, on my simple arithmetic, which ignores noncontrolling interest and participating securities). Hubbell's full-year adjusted tax rate guide is 22.0% to 22.5%. GAAP shows the same pressure: the effective tax rate was about 23.4% against 17.5% (derived from $80.7M of tax on $345.3M of pre-tax income).
The gap between GAAP and adjusted EPS also widened. Adjusted EPS is $0.97 above GAAP, 16% of the adjusted figure (derived). Acquisition-related amortization accounts for $0.89 of that gap, up from $0.35 a year ago. For the full year Hubbell guides to about $2.50 of amortization and $0.60 of transaction and integration costs per share.
Sources: Hubbell Exhibit 99.1.
Forensic #4: Net Debt Is Up 170%, And Q4 Cash Flow Has To Jump 56%
Hubbell funded NSI with new debt, and its stated cash conversion target now depends on a strong Q4.
| Balance sheet | Sep 30, 2026 | Dec 31, 2025 | Change |
|---|---|---|---|
| Cash and cash equivalents | $334.5M | $482.5M | -31% (d) |
| Total debt | $5,120.2M | $2,325.4M | +120% (d) |
| Net debt | $4,664.7M | $1,729.1M | +170% (d) |
| Net debt to total capital | 51% | 28% | +23 pts |
| Goodwill | $4,368.2M | $3,060.8M | +43% (d) |
| Other intangibles | $3,143.4M | $1,394.3M | +125% (d) |
| Accounts receivable | $1,228.8M | $856.9M | +43% (d) |
| Inventories | $1,327.2M | $1,083.8M | +22% (d) |
| Total assets | $11,898.3M | $8,228.8M | +45% (d) |
| Hubbell shareholders' equity | $4,105.6M | $3,847.9M | +7% (d) |
(d) = derived. Source: Hubbell Exhibit 99.1.
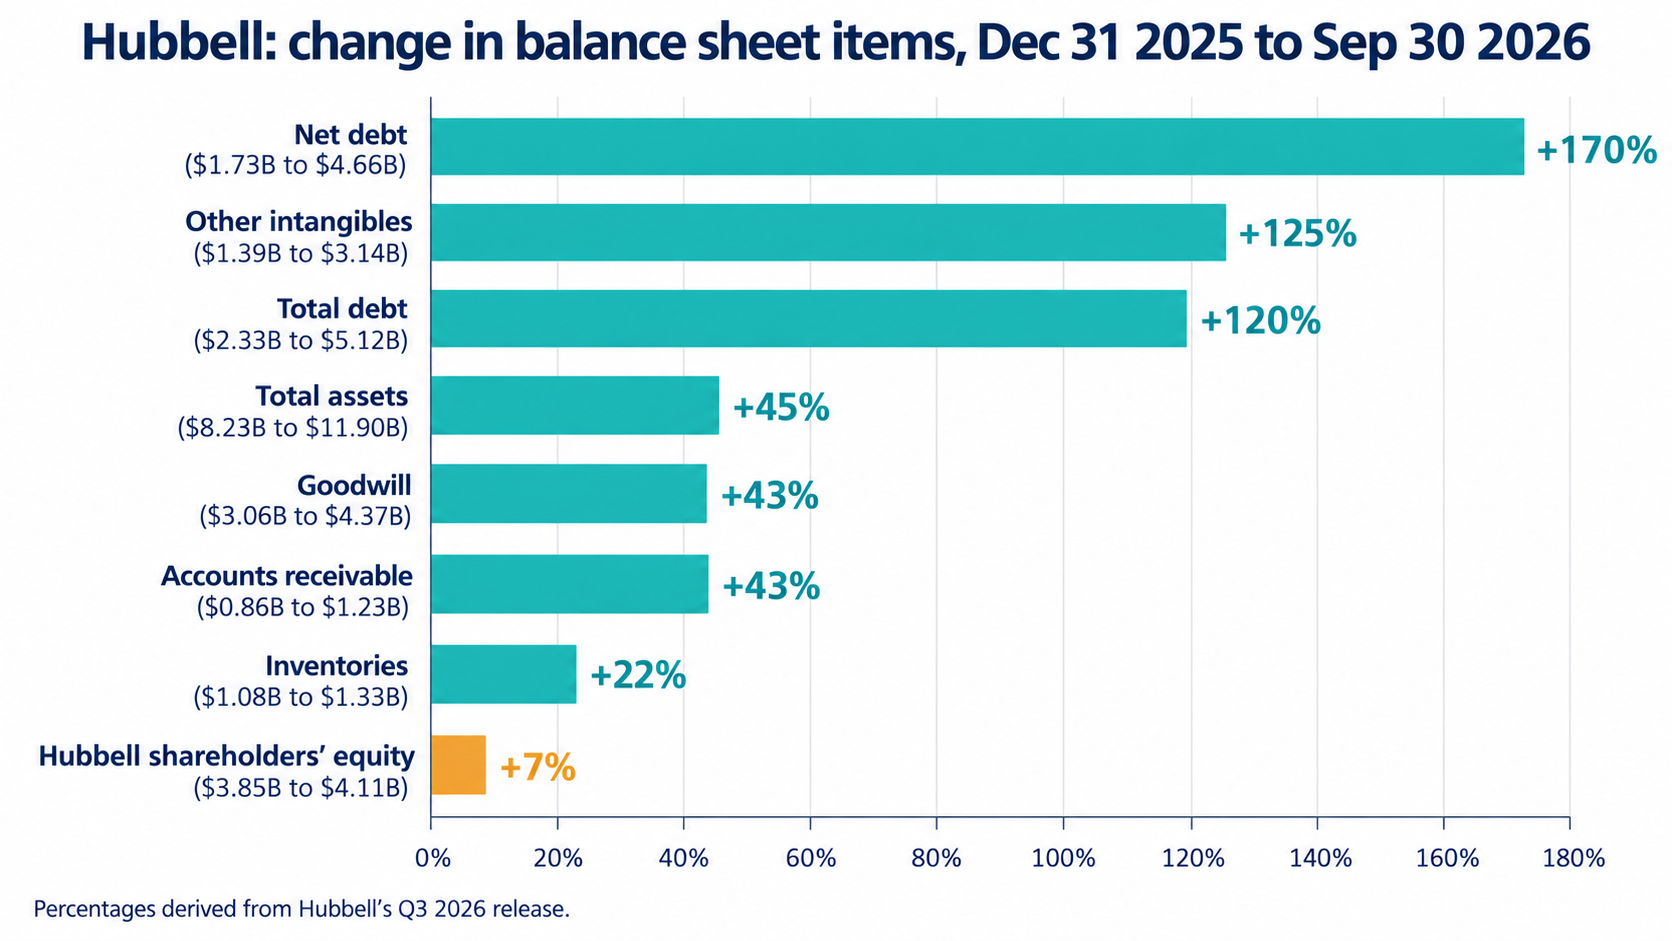
Hubbell Balance Sheet Changes From Dec 31, 2025 To Sep 30, 2026 (Self-Made)
In nine months Hubbell spent $3,005.7M on acquisitions, $225.4M on dividends and $203.5M on share repurchases, a total of $3,434.6M against $539.2M of free cash flow (derived). Long-term debt proceeds were $2,787.5M, and the 10-Q lists a $900M term loan and $1.9B of senior notes, plus commercial paper. It does not state interest rates. Net debt is about 2.3 times annualised Q3 adjusted EBITDA of $506.9M (derived, and a rough measure because Q3 includes a full quarter of NSI).
Goodwill and intangibles are $7,511.6M, or 63% of total assets and 183% of Hubbell shareholders' equity (derived). Equity minus goodwill and intangibles is about -$3.4B, against about -$0.6B at year end (derived, before the $819.1M of deferred tax liabilities that partly relate to those intangibles). Receivables grew 43% and inventories 22% since December, versus +24.6% sales growth in the quarter. Part of that is NSI and seasonality, and the filings I read do not split the effect.
Hubbell guides to free cash flow of about 90% of adjusted net income. Nine-month free cash flow of $539.2M is 66% of nine-month adjusted net income of $817.9M (derived). Using 53.2M shares, the full-year adjusted EPS guide implies adjusted net income of about $1,085M to $1,096M, so a 90% conversion implies full-year free cash flow near $977M to $986M and Q4 free cash flow of about $438M to $447M (derived). That is 56% to 59% above Q3's $280.4M.
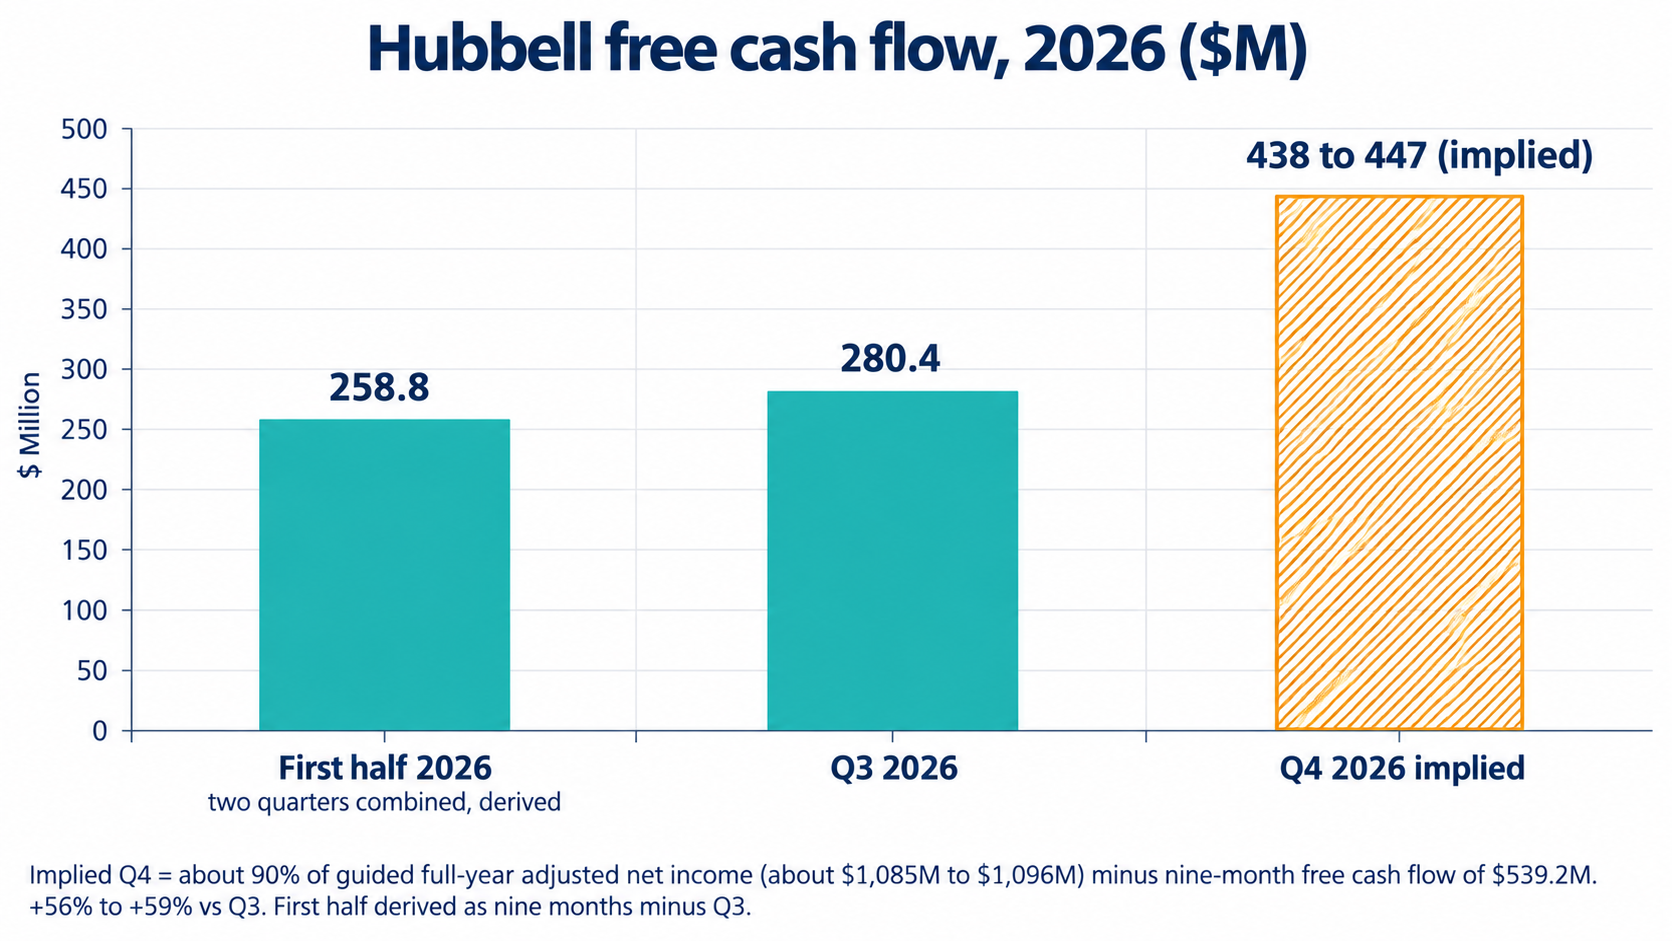
Free Cash Flow By Period, With The Q4 Level Implied By Hubbell's Guidance, $M (Self-Made)
Sources: Hubbell Exhibit 99.1; Hubbell Form 10-Q, Note 2 and cash flow statement.
Valuation Snapshot
At $459.40, Hubbell traded at 22.4x the midpoint of its 2026 adjusted EPS guide, and about 21.4x at the $438 intraday level.
| Measure | At $459.40 (Oct 26 close) | At $438.23 (Oct 27 intraday) |
|---|---|---|
| Market capitalisation (52.835M shares) | $24.3B | $23.2B |
| Enterprise value (plus net debt of $4.66B) | $28.9B | $27.8B |
| Price / 2026 adjusted EPS guide midpoint ($20.50) | 22.4x | 21.4x |
| Price / 2026 GAAP EPS guide midpoint ($17.40) | 26.4x | 25.2x |
| Enterprise value / annualised Q3 adjusted EBITDA ($2.03B) | 14.3x | 13.7x |
| Implied free cash flow yield (about $0.98B) | 4.0% | 4.2% |
All ratios are derived. Enterprise value excludes noncontrolling interests and pension items. Shares outstanding as of Oct 22, 2026 are from the 10-Q. The free cash flow figure is 90% of the guided adjusted net income midpoint, not a reported number. Annualising one quarter ignores seasonality.
TIKR puts the forward P/E at about 21x before the report and closer to 20x after the drop. That is a different, forward-year basis from the 2026 guidance used here. The calculations show how much of the multiple depends on adjusted EPS, since GAAP EPS guidance is about $3.10 lower per share.
Sources: Hubbell Exhibit 99.1; Hubbell Form 10-Q; TIKR; MarketBeat and Investing.com quotes.
Risks: What Would Break The Thesis
The concern is earnings quality and leverage. These are the facts that would show it is wrong, or worse.
- The refund does not repeat. If it sits inside adjusted results and no further refunds arrive, Q4 loses a cushion worth about 6.5% of Q3 adjusted operating income (derived). Further refunds would help, but Hubbell has not given an amount or timing.
- Q4 EPS guide. The guide implies adjusted EPS of $5.03 to $5.23 in Q4, below Q3's $5.91. If the refund is excluded, Q3 was about $5.46, so the implied drop is smaller (derived).
- Cash conversion misses. Q4 free cash flow of about $438M to $447M would be the best quarter of the year. A shortfall would put the 90% target at risk while receivables and inventories are higher.
- Interest and tax. If interest stays near $58M a quarter and the tax rate stays above the 22.0% to 22.5% guide, adjusted EPS growth stays below operating income growth.
- Utility Solutions. Organic growth of 4.9% and Grid Automation down about 4% need to recover. Management calls the meter issue a temporary component shortage; this article cannot confirm that.
- Integration. NSI's margin since closing is about 10.8% on a GAAP basis (derived), and goodwill is preliminary. Lower than expected results or purchase price adjustments would affect both.
What To Watch Next
- Q4 results and the 2027 outlook. Check adjusted EPS against the implied $5.03 to $5.23, and free cash flow against the roughly $440M needed.
- Further tariff refunds. Look for an amount, timing, and whether they are included or excluded from adjusted results.
- Net debt and interest. The pace of debt paydown, the interest rates on the $900M term loan and $1.9B of notes, and whether net debt to total capital moves back below 51%.
- Grid Automation. Whether sales return to growth and the component shortage ends.
- NSI disclosure. Separate NSI sales and operating income, the final purchase price allocation, and any change in the $1,303.9M of goodwill.
- Working capital. Receivables and inventories relative to sales at year end.
Sources And Data Notes
Financial figures come from Hubbell's Q3 2026 results release (Exhibit 99.1 to Form 8-K) and its Form 10-Q for the quarter ended September 30, 2026. Hubbell reported on Oct 27, 2026 before the open. Prices below are from Oct 26 and Oct 27 and will have moved.
Primary sources
- Hubbell Q3 2026 results, Exhibit 99.1 to Form 8-K, Oct 27, 2026
- Hubbell Form 10-Q for the quarter ended Sept 30, 2026
Secondary sources
- TIKR: $5.75 adjusted EPS estimate, prior guidance range, consensus guide, stock move, management comment on meters
- MarketBeat and Investing.com: Oct 26 close and Oct 27 premarket, opening and intraday prices
Marked, not independently confirmed
- The prior full-year guidance range ($20.25 to $20.55) and the $5.75 estimate come from TIKR, not from Hubbell's release, which does not state the prior range.
- The treatment of the $31M tariff refund inside adjusted results is my reading of the reconciliation. The release and the 10-Q do not say it directly.
Where sources disagree
- Q3 operating cash flow is $322.6M in the table and $323M in the release text. Q3 Electrical Solutions adjusted operating income is $209.5M in the table and about $210M in the text. I used the table figures.
- Nine-month transaction, integration and separation costs are $30.2M in the segment table and $37.4M in the EPS reconciliation. The $7.2M difference is bridge financing cost booked in interest expense.
- The Oct 27 move is -4.6% (intraday), -6.3% (open) and about -6% (TIKR) against the Oct 26 close. I could not confirm the closing price.
Left out
- Backlog: the release says it built during the quarter but gives no total, and the 10-Q only gives the $11.0M backlog intangible from the NSI purchase price allocation.
- Data center end-market figures and a quarterly dividend change, which I could not confirm from the primary filings.
- I did not read the 10-Q risk factor section, so risk items above come from the financial statements and notes, not from Hubbell's own risk disclosure.
Derived figures are my arithmetic from the release and the 10-Q and are marked (d), "derived" or "my arithmetic".

Sandeep Gupta
Independent equity research analyst publishing forensic theses on US-listed stocks. MBA, Politecnico di Milano School of Management (Milan, Italy).
Get new research in your inbox
Subscribe to receive forensic equity research the moment it's published. Free, no spam.
Related Research
 HON
Honeywell (HON): Adjusted EPS Up 34%, GAAP EPS Down 20%, And Operating Cash Flow Down 74%
 GE
GE Aerospace (GE): Orders Up 49% And Adjusted EPS Up 36%, But Free Cash Flow Fell 14% And The Guide Implies A Softer Q4
 LMT
Discussion
Be the first to comment.