
Investment Thesis
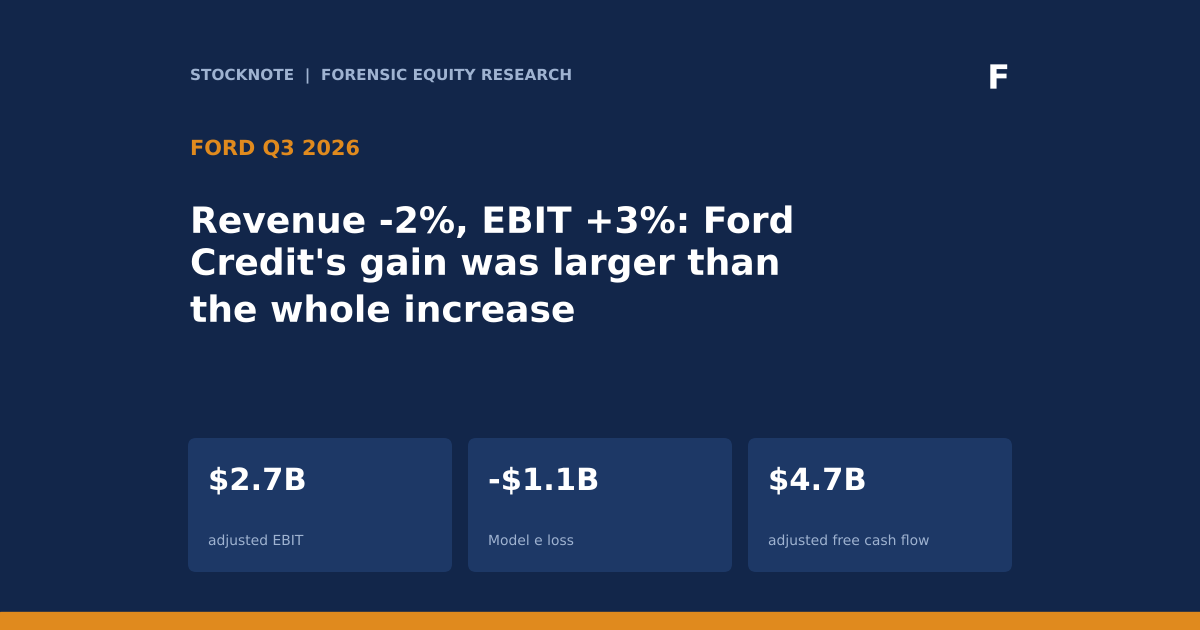
Ford reported third-quarter revenue of $49.5B, down 2%, and adjusted EBIT of $2.7B, up 3%. By my arithmetic, Ford Credit's $172M earnings gain is larger than the total EBIT increase of about $80M (d), so the auto segments combined earned less than a year ago, with Ford Blue down 10%, Ford Pro down 16% and Model e still losing $1.1B on $1.2B of revenue.
- Results. Revenue was $49.5B (-2%), adjusted EBIT $2.7B (+3%), and adjusted free cash flow $4.7B. Cash was $25.3B and total liquidity $46.4B. The Q4 dividend is $0.15 a share.
- Ford Blue. Revenue was $27.1B (-3%) and EBIT $1.4B (-10%), a margin of about 5.2% (d).
- Ford Pro. Revenue was $17.8B (+2%) despite wholesale volume down 4%, but EBIT was $1.7B (-16%). Its margin is about 9.6% against 11.6% a year ago (d).
- Model e. Revenue was $1.2B and the EBIT loss $1.1B, improved 25%. The loss was about 92% of revenue (d).
- Ford Credit. Earnings before tax were $803M, up $172M. By my arithmetic Ford Credit was about 29% of the four segments' earnings (d).
- 2026 guide. Adjusted EBIT of $10.5B to $11.0B (low end raised), adjusted free cash flow $6B to $7B, capex $9.5B to $10.5B. The segment guides add to about $11.3B, above the company range (d).
- 2027 and 2029. Profitability in 2027 is targeted roughly in line with 2026, with a commodities, memory and logistics headwind of about $2B, and an 8% adjusted EBIT margin by 2029.
- This article contains no price target or rating. Every figure comes from the executives' spoken remarks on the Q3 call or a named source, and anything I calculated is marked (d).
Bottom line. Ford's headline is stable, but its composition has weakened: the finance arm provided more than all of the EBIT increase while the two biggest vehicle segments fell. With a guide that raises only the low end and segment guides above the company range, the investor focus should be on Ford Pro, which the 2026 guide counts on for about $7B.
Source: Ford Q3 2026 earnings call transcript, Motley Fool, Oct 29, 2026.
Q3 2026 At A Glance
| Metric (Q3 2026) | Result | Change |
|---|---|---|
| Revenue | $49.5B | -2% |
| Adjusted EBIT | $2.7B | +3% |
| Adjusted free cash flow (company) | $4.7B | n/a |
| Cash / total liquidity | $25.3B / $46.4B | n/a |
| Ford Blue revenue / EBIT | $27.1B / $1.4B | -3% / -10% |
| Model e revenue / EBIT | $1.2B / -$1.1B | loss improved 25% |
| Ford Pro revenue / EBIT | $17.8B / $1.7B | +2% / -16% |
| Ford Credit EBT | $803M | +$172M |
| Software, services and parts | about 10% of revenue | n/a |
| F-150 inventory | 49 retail days' supply | target 55 to 65 |
Adjusted EPS was not spoken; the page summary lists $0.49, which I excluded. Source: Ford Q3 2026 call transcript.
What The Market Believes vs. What The Data Actually Shows
| Belief | What the call shows |
|---|---|
| Ford earnings are growing | Adjusted EBIT rose 3%, but Ford Credit's +$172M exceeded the whole increase (d). |
| Ford Pro is the profit engine | Ford Pro EBIT fell 16% despite revenue growth of 2%; its margin fell about two points (d). |
| Model e losses are shrinking | The loss narrowed 25% to $1.1B, but it is still about 92% of Model e revenue (d), and the full-year loss guide is about $4B. |
| The guide is secure | The raised low end is $10.5B; the segment guides add to about $11.3B (d). |
| Tariffs are a major drag | Tariffs were described as lower, but no dollar amount was given. |
The call gave no consensus; prices are in the Valuation Snapshot.
A 3% EBIT increase on lower revenue reads as resilience. The segment detail reads differently, because the improvement came from the finance arm and a narrowing Model e loss, neither of which is a vehicle profit engine.
Forensic #1: Ford Credit Was More Than The Whole EBIT Increase
| Segment | Q3 2026 | Change | Estimated change in $ (d) |
|---|---|---|---|
| Ford Blue EBIT | $1.4B | -10% | -$156M |
| Ford Pro EBIT | $1.7B | -16% | -$324M |
| Model e EBIT | -$1.1B | loss improved 25% | +$367M |
| Ford Credit EBT | $803M | +$172M | +$172M |
| Sum of segments (d) | n/a | n/a | +$59M |
| Company adjusted EBIT | $2.7B | +3% | about +$80M (d) |
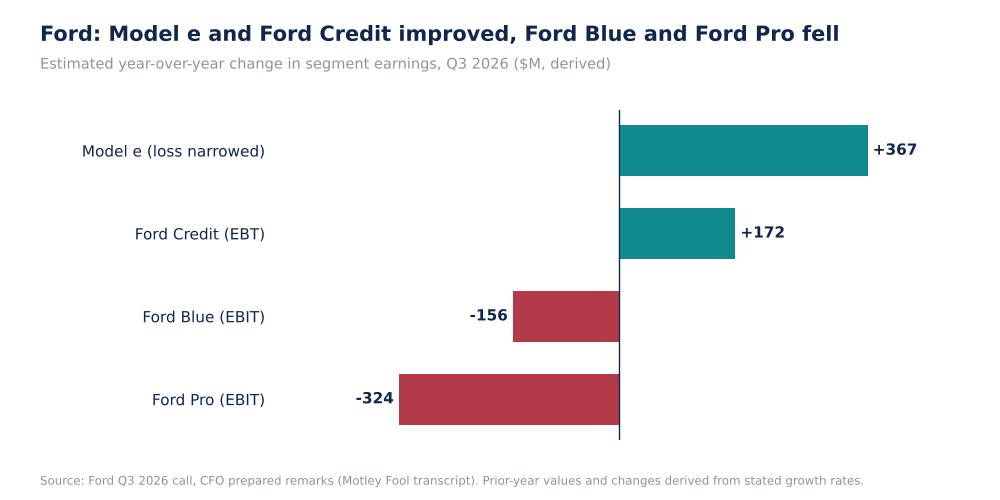
Estimated Change In Ford Segment Earnings, Q3 2026 vs Q3 2025, $M, Derived (Self-Made)
The prior-year values are backed out of rounded percentages, so the dollar changes are approximate. Excluding Ford Credit, Ford's other segments and corporate items earned about $1.9B against about $2.0B a year ago (d), a decline of about 5%. This assumes Ford Credit's EBT is included in company adjusted EBIT, which the call did not state.
Why it matters. Ford Credit's earnings depend on credit losses and interest spreads, not on vehicle demand, so its $172M gain is a different kind of earning from Pro and Blue margins. If Ford Credit earnings revert, adjusted EBIT would fall unless the vehicle segments recover.
Source: Ford Q3 2026 call transcript.
Forensic #2: Ford Pro's Margin Fell About Two Points
| Segment | Q3 2026 revenue | Q3 2026 EBIT | Margin (d) | Prior-year margin (d) |
|---|---|---|---|---|
| Ford Pro | $17.8B | $1.7B | 9.6% | about 11.6% |
| Ford Blue | $27.1B | $1.4B | 5.2% | about 5.6% |
| Model e | $1.2B | -$1.1B | about -92% | n/a (prior-year revenue not given) |
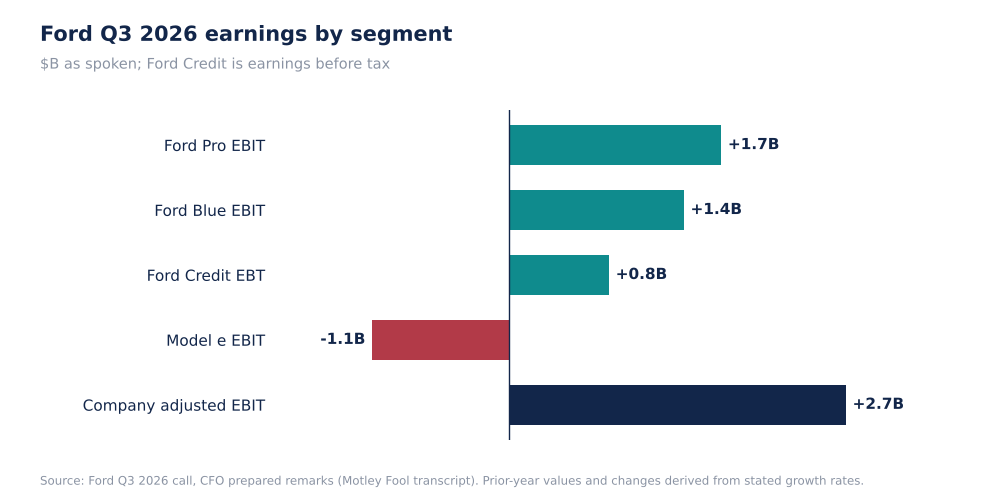
Ford Q3 2026 Earnings By Segment, $B (Self-Made)
Ford Pro revenue grew 2% while wholesale volumes fell 4%, which means revenue per unit rose; the call did not break out the mix or pricing effect behind the 16% EBIT fall. Management said retail pricing is expected up about 1 point in 2026 and fleet pricing is up over 1%.
Why it matters. Ford Pro is the highest-margin vehicle segment, and its margin fell about two points while revenue rose. The 2026 guide of about $7B is about $1.75B a quarter, so Q3's $1.7B is on pace but with a falling margin. A further decline in Pro would affect the company more than any other segment.
Source: Ford Q3 2026 call transcript. Margins and prior-year values are derived.
Forensic #3: The Segment Guides Add To More Than The Company Guide
| 2026 guide | Amount |
|---|---|
| Ford Blue EBIT | about $5.5B |
| Ford Pro EBIT | about $7.0B |
| Model e loss | about -$4.0B |
| Ford Credit EBT | about $2.8B |
| Sum (d) | about $11.3B |
| Company adjusted EBIT | $10.5B to $11.0B |
| Implied other items (d) | about -$0.3B to -$0.8B |
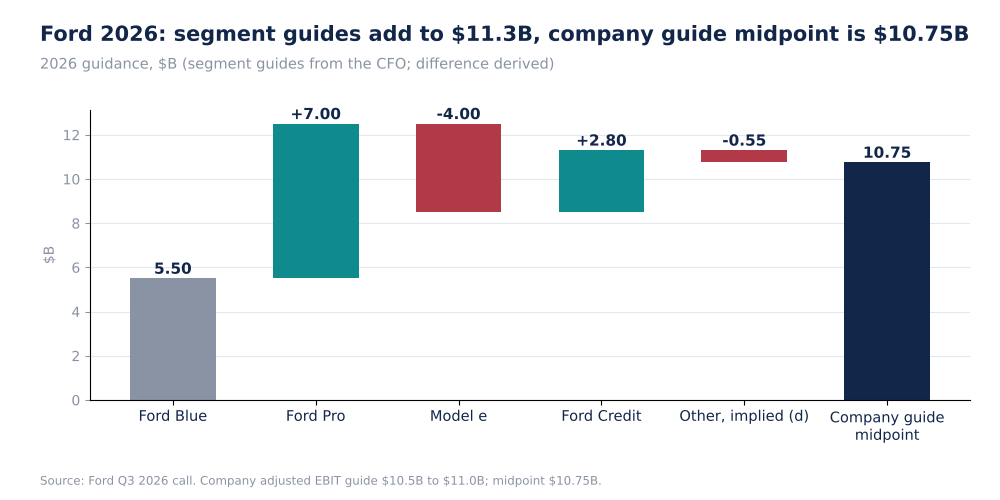
Ford 2026 Segment Guidance vs Company Guidance Midpoint, $B (Self-Made)
The $0.3B to $0.8B gap is the amount by which the segment guides exceed the company range, so it implies corporate and other costs. In Q3 the same arithmetic gives about -$0.1B (segments of about $2.8B against $2.7B, d). The call did not describe this item.
Why it matters. The $0.3B to $0.8B gap between the segment guides and the company range shows how little cushion the guide has. A $0.5B shortfall at Pro, about 7% of its guide, would take the implied company range to about $10.0B to $10.5B, at or below the stated low end (d).
Source: Ford Q3 2026 call transcript.
Forensic #4: Cash, Capex And Costs
| Item | Figure |
|---|---|
| Q3 adjusted free cash flow | $4.7B |
| 2026 adjusted free cash flow guide | $6B to $7B (unchanged) |
| 2026 capex guide | $9.5B to $10.5B (unchanged) |
| Cash / liquidity | $25.3B / $46.4B |
| Warranty and material cost reductions, 2025 | $1.5B; further $1B targeted in 2026 |
| Novelis temporary costs, year to date | about $1B; net tailwind about $1B targeted for 2026 |
| Commodity headwinds 2026 | approaching $2.5B, up about $500M |
| Ford Energy investment | about $2B, one-third in 2026 |
| F-150 gross stocks | up about 6% versus Q2 |
The Q3 free cash flow of $4.7B is 67% to 78% of the $6B to $7B full-year guide (d), but year-to-date free cash flow was not given, so I cannot say how much remains for Q4. Operating cash flow, Q3 capex and debt were not spoken.
Why it matters. Adjusted free cash flow of $4.7B in one quarter is a large part of the $6B to $7B guide, but the call did not give year-to-date figures. A guided yield of 12% to 15% of market cap means the market is not paying for the guide in full, and Q4 will show whether the cash flow is as durable as guided.
Source: Ford Q3 2026 call transcript.
Valuation Snapshot
TradingView shows Ford at $12.27, up 3.4% on the day, with a market cap of $47.7B on one part of the page and $49.3B on another. A note on the page cites an Oct 28 close of $11.95. Trailing GAAP EPS is -$1.81.
| Measure | Figure |
|---|---|
| Share price (TradingView) | $12.27 |
| Market cap (TradingView) | $47.7B to $49.3B (two figures on the page) |
| Dividend yield: $0.15 a quarter / price (d) | about 4.9% |
| 2026 adjusted free cash flow guide of $6B to $7B / market cap (d) | about 12% to 15% |
| 2026 adjusted EBIT guide | $10.5B to $11.0B |
| Trailing GAAP EPS (TradingView) | -$1.81 |
Free cash flow guidance of about 12% to 15% of market cap is the investor case, but the guide depends on Ford Pro holding about $7B of EBIT after a 16% Q3 fall, on a $4B Model e loss, and on Ford Credit continuing to supply earnings.
What has to be true. At a 4.9% dividend yield and a guided free cash flow of 12% to 15% of market cap, the stock is priced for the guide not being met or for cash flows being less durable than guided. Meeting the guide while Pro stabilises would close part of that gap. The tests are the Q4 results and 2027 commentary on the commodity headwind of about $2B.
Risks: What Would Break The Thesis
- Ford Pro weakens further. EBIT fell 16%, and the 2026 guide of about $7B relies on it.
- Model e. A loss of about $4B for the year on small revenue.
- Commodities. Headwinds approaching $2.5B in 2026 and about $2B in 2027.
- Guide arithmetic. Segment guides exceed the company range by about $0.3B to $0.8B.
- Data limits. The release was not read; adjusted EPS and operating cash flow were not spoken.
The risk list is concrete and quantified: $2.5B of commodity headwinds in 2026, a $4B Model e loss and a falling Pro margin. The offsets are Ford Credit and the $1B of warranty and material cost reductions targeted for 2026.
What To Watch Next
- Ford Pro EBIT and margin against $1.7B and 9.6%.
- Model e loss against the about $4B full-year guide.
- Q4 adjusted EBIT against the $10.5B to $11.0B range.
- Ford Credit earnings, which carried the quarter's increase.
- Year-to-date free cash flow in the 10-Q.

Sandeep Gupta
Independent equity research analyst publishing forensic theses on US-listed stocks. MBA, Politecnico di Milano School of Management (Milan, Italy).
Get new research in your inbox
Subscribe to receive forensic equity research the moment it's published. Free, no spam.
Related Research
 HON
Honeywell (HON): Adjusted EPS Up 34%, GAAP EPS Down 20%, And Operating Cash Flow Down 74%
 GE
GE Aerospace (GE): Orders Up 49% And Adjusted EPS Up 36%, But Free Cash Flow Fell 14% And The Guide Implies A Softer Q4
 LMT
Discussion
Be the first to comment.