
Investment Thesis
Existing-home sales rose 1.5% in September to a seasonally adjusted annual rate of 3.99 million but were still 2.2% lower than a year earlier, and the National Association of Realtors said August and September were the two slowest months of the year. Prices keep rising (median $417,500, +1.3% over twelve months, the 39th consecutive annual gain), inventory is up 4.6% to 1.60 million homes and months' supply is 4.8. At the same time, Freddie Mac's 30-year mortgage rate was 7.24% on October 29, against 6.17% a year earlier. This article uses the mechanics of a mortgage payment to show what a one-point rise in rates does to buyers, how that feeds into sales and prices, and what the regional data say.
- Sales. 3.99 million (SAAR), +1.5% month over month, -2.2% year over year. Single-family 3.64 million (+2.0% m/m, -1.9% y/y); condo/co-op 350,000 (-2.8% m/m, -5.4% y/y).
- Prices and supply. Median $417,500 (+1.3% y/y); inventory 1.60 million (+1.9% m/m, +4.6% y/y); 4.8 months' supply (4.5 a year ago); median 33 days on market.
- Buyers. First-time buyers 31% of sales (30% a year ago); cash sales 27% (30%); investors and second-home buyers 20% (15%); distressed sales 2%.
- Rates. Freddie Mac: September average 6.86% (6.67% in August, 6.35% a year earlier); weekly 7.28% (Oct 1), 7.40% (Oct 15), 7.32% (Oct 22), 7.24% (Oct 29).
- Affordability. NAR Housing Affordability Index 105.4 (106.7 a year earlier). NAR's Lawrence Yun said further rate increases mean fewer buyers can qualify.
- This article contains no rating, price target or investment advice. Every figure comes from a named source and anything I calculated is marked (d).
Bottom line. Prices are holding because few homes are for sale and sellers have not been forced to cut; the adjustment so far is in volume. A $417,500 home bought with 20% down costs about $237 a month more in principal and interest at 7.24% than at last year's 6.17% (d), or 11.6% more (d). To offset that with price alone, the home would need to cost about 10.4% less (d), a decline of about $43,000 that the data do not show (median prices are up 1.3%). The adjustment is therefore being made through fewer transactions. Because September sales reflect contracts signed earlier, the October rate peak is not yet visible in them.
Sources: NAR, existing-home sales, September 2026; Mortgage News Daily on the NAR release; Trading Economics, Freddie Mac weekly series.
September 2026 At A Glance
| Metric | September 2026 | Comparison |
|---|---|---|
| Existing-home sales (SAAR) | 3.99M | -2.2% y/y; +1.5% m/m |
| Median price | $417,500 | +1.3% y/y (from $412,300) |
| Inventory | 1.60M | +4.6% y/y |
| Months' supply | 4.8 | 4.5 a year ago |
| Days on market (median) | 33 | 31 in August; unchanged y/y |
| First-time buyers | 31% | 30% a year ago |
| Cash sales | 27% | 30% a year ago |
| Freddie Mac 30-year (monthly avg) | 6.86% | 6.35% a year ago |
| Affordability index | 105.4 | 106.7 a year ago |
Source: NAR, Oct 13, 2026.
What The Market Believes vs. What The Data Actually Shows
| Belief | What the data show |
|---|---|
| High rates will cause prices to fall | The median price rose 1.3% year over year, the 39th consecutive gain, with 4.8 months of supply, which is not a buyer's market by NAR's data. Regional prices fell only in the West (-0.3%). |
| Mortgage rates track the Fed | They track long yields: the 30-year rate was 2.22 points above the 10-year Treasury yield on Oct 29 (d: 7.24 - 5.024), and fell only 4 basis points between Oct 1 and Oct 29 (7.28% to 7.24%). |
| Sales have collapsed | They are 3.99 million, -2.2% year over year, and +1.5% month over month; weak, but not falling at a steep rate in September. |
| Distressed sales are rising | They were 2% of sales, unchanged from August. |
| Buyers are mostly first-timers | First-time buyers were 31% (30% a year ago), and cash buyers 27%; investors and second-home buyers rose to 20% from 15%. |
The investor share is the most unusual number in the table. A jump from 15% to 20% of sales (d: +5 points) while first-time buyers are flat suggests that the marginal buyer is less rate-sensitive, though the NAR release extract does not give a reason, so this is an observation and not an explanation.
Forensic #1: What A Point Of Mortgage Rate Costs
| Rate | Monthly principal and interest (d) | Versus 6.17% (d) |
|---|---|---|
| 6.17% (Oct 29, 2025) | $2,039 | n/a |
| 6.35% (Sept 2025 avg) | $2,078 | +$39 |
| 6.86% (Sept 2026 avg) | $2,191 | +$152 |
| 7.24% (Oct 29, 2026) | $2,276 | +$237 (+11.6%) |
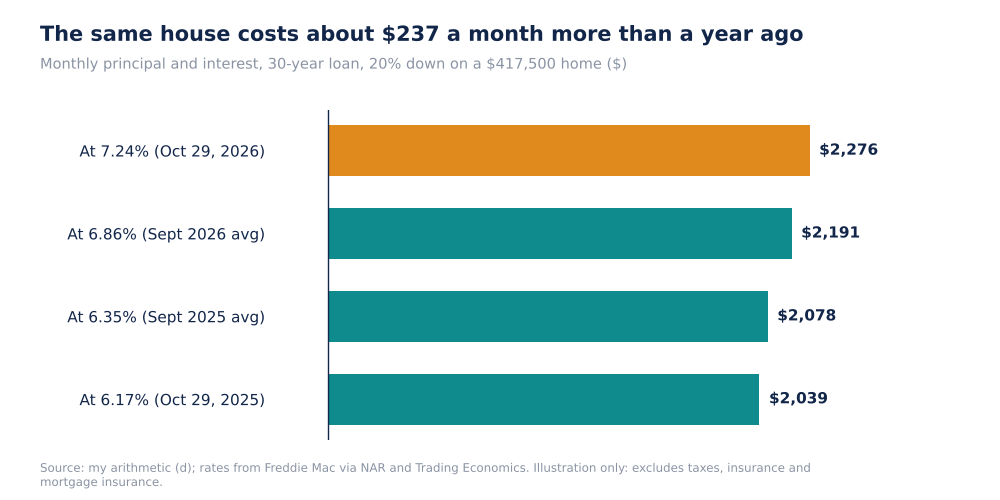
Monthly Principal And Interest, 20% Down On $417,500 (Self-Made, d)
The calculation uses a loan of $334,000 (80% of the median price), a 30-year term and the standard amortisation formula. It holds the price constant at $417,500 so that it isolates the effect of the rate. At 7.24% the payment is $2,276 against $2,039 at 6.17% (d), an increase of $237 a month, or $2,844 a year (d). This excludes property tax, insurance and mortgage insurance, so the full housing payment is higher, and a buyer with a smaller down payment is more exposed. To keep the payment at the 6.17% level with a 7.24% rate, the loan would have to be about 10.4% smaller, which at 20% down equals a price of about $374,000 (d).
Why it matters. The payment, not the price, is what determines how many households can qualify. A 1.07 point rise in the rate over a year (d: 7.24 - 6.17) has the same effect on the payment as a 10.4% rise in the price (d). Median prices rose only 1.3% in the same period, so the payment rose about 11.6% (d) on this comparison. NAR's Housing Affordability Index fell by only 1.3 points (105.4 from 106.7), but it compares September with September, when the rate gap was 0.51 points (6.86% against 6.35%) and the payment on my example rose 5.4% (d), and it also depends on income, which the extract does not give.
Sources: NAR; Trading Economics. Payments are my arithmetic (d), a stylised example.
Forensic #2: The Rate Path In October
| Week | 30-year rate, 2026 | Same week, 2025 | Difference (d) |
|---|---|---|---|
| Oct 1 | 7.28% | 6.34% | +0.94 |
| Oct 15 | 7.40% | 6.27% | +1.13 |
| Oct 22 | 7.32% | 6.19% | +1.13 |
| Oct 29 | 7.24% | 6.17% | +1.07 |
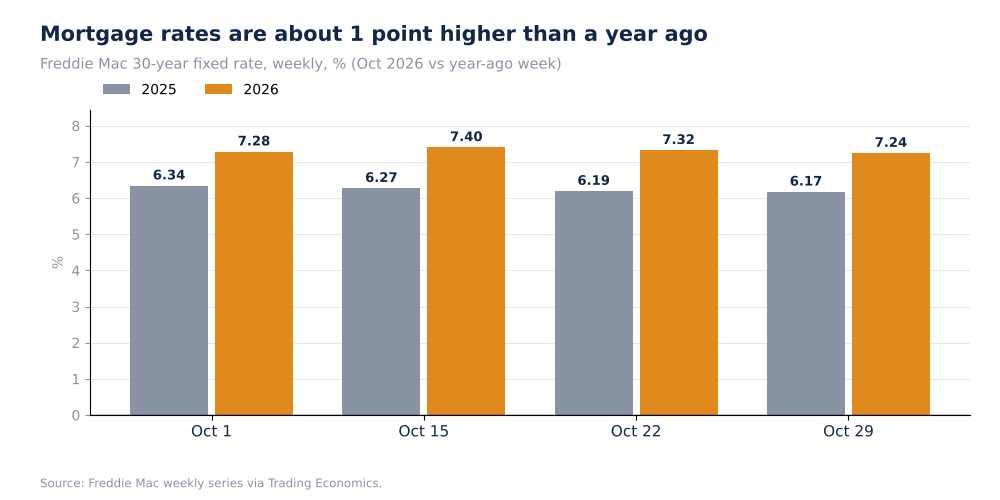
Freddie Mac 30-Year Rate, October Weeks, 2026 Vs 2025 (Self-Made)
The year-over-year gap has been above one point in each of the last three weeks (d). The weekly rate peaked at 7.40% on October 15, which was described as the highest since November 2023 and the eighth consecutive week without a decline, and has fallen for two weeks to 7.24% as Treasury yields eased (the 10-year was about 5.25% around October 1 and 5.024% on October 28). The Fed article in this series puts the probability of a December hike at 82.6% to about 85%, which would not by itself raise mortgage rates, since they follow the 10-year yield.
Why it matters. Existing-home sales are recorded at closing, which typically follows contract signing by roughly one to two months, so September's 3.99 million largely reflects contracts signed in July and August, when the Freddie Mac average was 6.67% in August (NAR). The rates of 7.24% to 7.40% now prevailing apply to contracts signed in October. If sales respond to rates with a lag, the October and November closings are the first to show it. That is my inference, not a figure in the data.
Sources: Trading Economics; NAR; Kiplinger. Differences are my arithmetic (d).
Forensic #3: Regional Differences
| Region | Sales (SAAR) | Sales y/y | Median price | Price y/y |
|---|---|---|---|---|
| Northeast | 470,000 | -4.1% | $523,600 | +4.7% |
| Midwest | 930,000 | -2.1% | $329,600 | +3.1% |
| South | 1.86M | -0.5% | $361,000 | +0.2% |
| West | 730,000 | -5.2% | $613,600 | -0.3% |
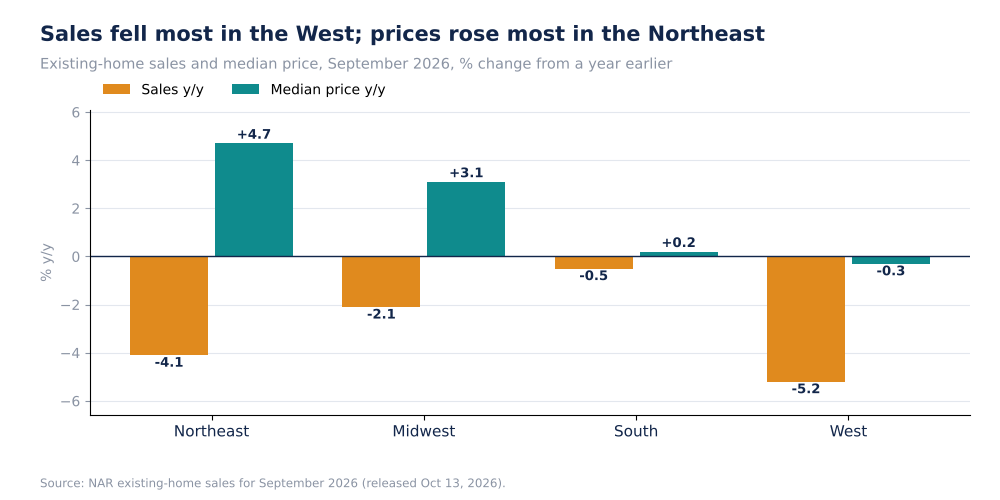
Existing-Home Sales And Median Price, % Change Y/Y By Region (Self-Made, NAR Data)
The South, which is the largest region (1.86 million of 3.99 million, or 47%, d), had the smallest decline in sales (-0.5%) and nearly flat prices (+0.2%). The Northeast and Midwest had the strongest price gains (+4.7% and +3.1%) with sales declines of 4.1% and 2.1%. The West, the most expensive region ($613,600), had the largest sales decline (-5.2%) and the only price decline (-0.3%). That pattern is consistent with the expectation that higher payments weigh most where prices are highest, since the payment effect scales with the loan size: the $237 monthly effect on a $417,500 home would be about $348 on the West's $613,600 median (d: 237 × 613.6 / 417.5, a proportional scaling).
Why it matters. The national median hides a split: markets where prices are still rising on thin inventory, and a market (the West) where volumes and prices are both falling. Housing-related investors need to separate regions before drawing conclusions from the national numbers.
Source: NAR. Share and scaling are my arithmetic (d).
Forensic #4: Supply, Time On Market And Who Is Buying
| Indicator | Sept 2026 | Aug 2026 | Sept 2025 |
|---|---|---|---|
| Inventory | 1.60M | 1.57M (d) | 1.53M (d) |
| Months' supply | 4.8 | 4.8 | 4.5 |
| Days on market | 33 | 31 | 33 |
| Cash sales | 27% | 27% | 30% |
| Investors and second homes | 20% | 15% | 15% |
| First-time buyers | 31% | 30% | 30% |
| Distressed sales | 2% | 2% | not given |
The inventory values for August and September 2025 are backed out of NAR's percentage changes (1.60M / 1.019 and 1.60M / 1.046, d) and are approximate. More supply (+4.6% year over year), a longer time on market (33 days against 31 in August) and a smaller share of cash buyers suggest that sellers have less pricing power than a year ago. NAR's Yun said higher inventory and longer selling times could push sellers toward price reductions or incentives, but the median price still rose.
Why it matters. The adjustment mechanism in housing is slow because most owners are not forced to sell, and the data show 2% distressed sales. The price adjustment would show first in the share of listings with reductions and in days on market, which are rising slightly. Neither is yet a signal of a price decline.
Source: NAR. Prior-period inventory is my arithmetic (d).
Valuation Snapshot
This is a macro article and no single valuation applies. The housing affordability inputs are:
| Measure | Level |
|---|---|
| Median existing-home price | $417,500 |
| 30-year mortgage rate (Oct 29) | 7.24% |
| Principal and interest, 20% down (d) | $2,276 a month |
| 10-year Treasury yield (Oct 28) | 5.024% |
| Mortgage spread to 10-year (d) | 2.22 points |
| Months' supply | 4.8 |
What has to be true. For prices to hold, inventory must stay scarce and sellers must remain willing to wait; for volumes to recover, mortgage rates have to fall or incomes rise faster than payments. A fall of 1 point in the mortgage rate would reduce the payment on the example loan by about $222 a month (d: $2,276 at 7.24% against about $2,054 at 6.24%), which is close to the size of the year's increase.
Risks: What Would Break The Thesis
- Lag. Sales for October and November will reflect rates above 7%; the September figure does not.
- Inventory. Up 4.6% year over year with longer time on market, which could lead to price cuts.
- Rates. The 10-year yield is volatile, and mortgage rates follow it.
- Composition. Median price is affected by which homes sell, so it is a weaker guide than a repeat-sales index.
- Data limits. The extracts do not give income, pending sales, price reductions or mortgage applications; payments are a stylised example.
If long yields fell by a point, sales could recover quickly because the payment effect reverses just as it built. If yields rose, the lag in closings suggests that the weakness has not yet been fully recorded.
What To Watch Next
- October existing-home sales, the first closings after the rate peak.
- The weekly Freddie Mac rate against 7.24%.
- Inventory against 1.60 million and months' supply against 4.8.
- The median price against $417,500 and the 39-month streak of annual gains.
- Days on market against 33 and the share of price cuts.
- Western sales and prices, where both are falling.

Sandeep Gupta
Independent equity research analyst publishing forensic theses on US-listed stocks. MBA, Politecnico di Milano School of Management (Milan, Italy).
Get new research in your inbox
Subscribe to receive forensic equity research the moment it's published. Free, no spam.

Discussion
Be the first to comment.