

Investment Thesis
Corning's Q3 was driven almost entirely by Optical Communications. The other segments together lost profit, core growth rates are not like for like, and cash flow is flattered by customer deposits and hedge gains while capex climbs.
- Earnings. Core sales were $5,081M (+19%) and core EPS was $0.91 vs $0.67 (+36%), against $0.88 expected (Investing.com). GAAP sales were $4,855M (+18%) and GAAP EPS was $0.78 vs $0.50 (+56%).
- One engine. Optical Communications sales rose $727M to $2,379M (+44%), which is 90% of the $809M increase in core sales (derived). Segment net income rose $151M in total, but Optical alone rose $237M, so the other four segments together fell 19% (derived).
- Not like for like. Corning changed how it restates currency in core results. The release says applying the new method to 2025 would have produced higher comparisons, so the 19% and 36% core growth rates are overstated against a consistent base.
- Cash flow. Adjusted free cash flow was $661M in Q3 and $2,272M over nine months (+131%). Nine-month results include $639M of customer deposits and incentives and $423M of realised hedge gains. Excluding both leaves about $1,210M, up 44% (derived).
- Capex. Q3 capex was $545M (+63%) and nine-month capex $1,299M (+53%). Management guides to about $2B for 2026 (call summary). Inventories are up 18.5% since December (derived).
- Guidance. Q4 core sales of $5.2B to $5.3B and core EPS of $0.96 to $1.00 are only 2% to 4% and 5% to 10% above Q3 (derived), with no full-year or 2027 capex numbers in the release.
- Stock. It closed at $127.74 on Oct 26 and fell about 3% to 4% on Oct 27 before reports of a rebound (sources disagree). At $127.74 it is about 38x the midpoint of implied 2026 core EPS (derived).
- This article contains no price target or rating. Every figure comes from Corning's release or a named source, and anything I calculated is marked.
Source: Corning Q3 2026 results, Exhibit 99.1 to Form 8-K, Oct 27, 2026.
Q3 2026 At A Glance
Core sales grew 19%, core operating income grew 37%, and GAAP net income attributable to Corning grew 58%.
| Metric (quarter ended Sept 30) | Q3 2026 | Q3 2025 | Change |
|---|---|---|---|
| Net sales (GAAP) | $4,855M | $4,100M | +18% |
| Core sales | $5,081M | $4,272M | +19% |
| Gross margin (GAAP / core) | 37.3% / 40.5% | 37.1% / 39.0% | +0.2 / +1.5 pts |
| Operating income (GAAP) | $911M | $589M | +55% (d) |
| Operating margin (GAAP / core) | 18.8% / 22.7% | 14.4% / 19.6% | +4.4 / +3.1 pts |
| Core operating income | $1,152M | $838M | +37% (d) |
| Net income attributable to Corning (GAAP) | $680M | $430M | +58% |
| Diluted EPS (GAAP) | $0.78 | $0.50 | +56% |
| Core net income | $795M | $585M | +36% |
| Core EPS | $0.91 | $0.67 | +36% |
| Effective tax rate (GAAP / core) | 22.9% / 18.5% | 14.5% / 19.5% | n/m |
| Operating cash flow | $1,061M | $784M | +35% (d) |
| Capital expenditures | $545M | $334M | +63% (d) |
| Adjusted free cash flow | $661M | $535M | +24% (d) |
| Core return on invested capital | 16.7% | 13.4% | +3.3 pts |
(d) = derived. Core results restate sales and income at Corning's hedged exchange rates and exclude items such as restructuring and pension marks (see Forensic #2). Source: Corning Q3 2026 results, Exhibit 99.1.
What The Market Believes vs. What The Data Actually Shows
Corning beat core EPS and guided Q4 above consensus, yet the shares fell on the day of the report because of the capex bill and the valuation.
| Item | Result or guide | Comparison |
|---|---|---|
| Core EPS | $0.91 | $0.88 expected (Investing.com, 247wallst), +$0.03 |
| Core sales | $5.08B | $5.03B expected (Investing.com), +1% |
| Q4 core sales | $5.2B to $5.3B | About +19% year over year (release) |
| Q4 core EPS | $0.96 to $1.00 | About +36% year over year (release) |
| 2026 capital expenditures | About $2B | Nine months: $1.3B (call summary) |
| Springboard plan | $20B annual sales run rate by end 2026, $30B by 2028, $40B by 2030 | Q3 run rate $20.3B (call summary); Q3 core sales x 4 = $20.3B (derived) |
Price reaction: Corning closed at $127.74 on Oct 26. On Oct 27 it traded down 2.97% to $123.94 premarket and later showed $122.80, down 3.87% (Investing.com). Reports on Oct 28 disagree: TradingKey says the stock rose 3.42%, and a Yahoo Finance article says it eased another 1.1%. I could not confirm any closing price after Oct 26. Yahoo also reports the stock about 19% lower over the past month, and Investing.com puts the 52-week high at $271.78, which would put $127.74 about 53% below it (derived).
Investing.com attributes the fall to concerns about the roughly $2B capex programme and the valuation, with a trailing P/E near 59. Management said its customer agreements include mechanisms such as upfront customer funding to help balance the spending. That is the company's description as reported in a call summary.
Sources: Corning Exhibit 99.1; Investing.com slides summary; Investing.com call transcript summary; 247wallst; TradingKey; Yahoo Finance.
Forensic #1: Optical Drove 90% Of Core Sales Growth, And The Rest Lost Profit
Corning is now a fibre company with four smaller businesses attached.
| Segment (core basis) | Q3 2026 sales | Q3 2025 sales | Sales change | Q3 2026 net income | Q3 2025 net income | Net income change |
|---|---|---|---|---|---|---|
| Optical Communications | $2,379M | $1,652M | +$727M (+44%) | $532M | $295M | +$237M (+80%) |
| Glass Innovations | $1,506M | $1,560M | -$54M (-3%) | $328M | $363M | -$35M (-10%) |
| Automotive | $470M | $454M | +$16M (+4%) | $67M | $68M | -$1M (-1%) |
| Solar | $436M | $319M | +$117M (+37%) | -$7M | $30M | -$37M |
| Life Sciences and Emerging Growth | $290M | $287M | +$3M (+1%) | -$28M | -$15M | -$13M |
| Total | $5,081M | $4,272M | +$809M (+19%) | $892M | $741M (d) | +$151M (+20%) (d) |
(d) = derived. Segment figures are on Corning's core basis and do not tie to GAAP net income of $680M; the release gives no bridge. Source: Corning Exhibit 99.1; my arithmetic.
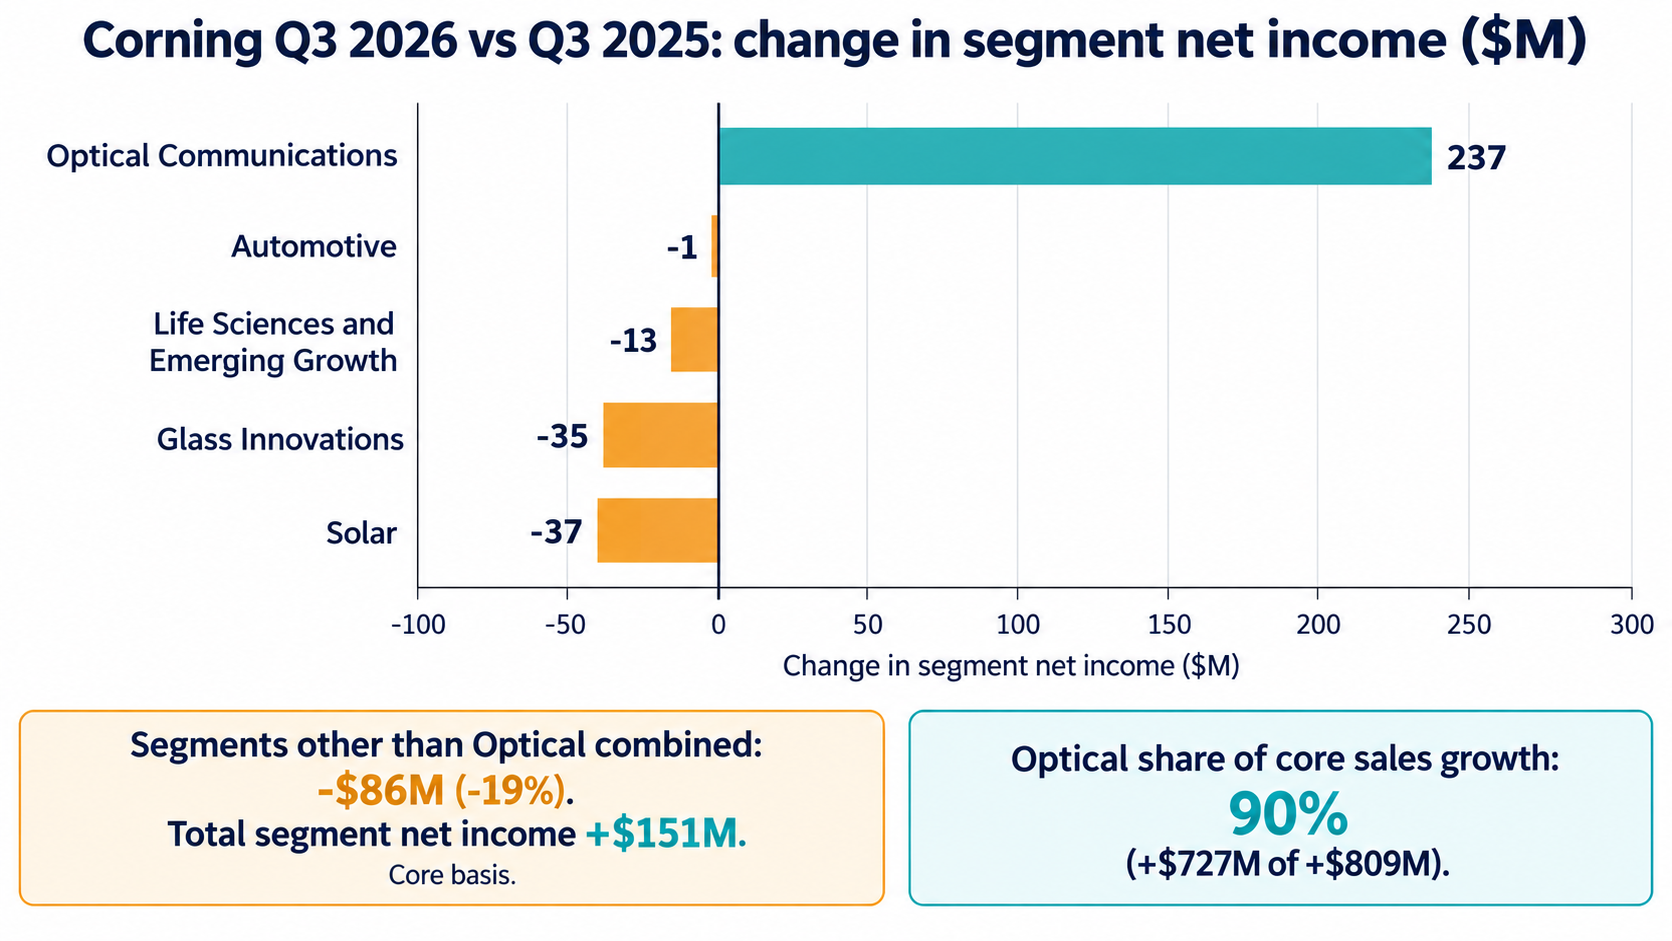
Q3 2026 Change In Segment Net Income vs Q3 2025, $M (Self-Made)
Optical is 46.8% of core sales and 59.6% of segment net income (derived). Its net margin rose to 22.4% from 17.9% (derived). Everything else combined had sales of $2,702M, up 3.1%, and net income of $360M, down 19% from $446M, a net margin of 13.3% against 17.0% (derived).
The release also cites Enterprise Networks sales up 84% and Gen AI product sales up more than 100%, without dollar figures or a statement of how they map to segments. Solar is the sharpest drag: sales rose 37% but the segment lost $7M, and management said on the call that the production ramp is slower than planned and improvement will be slow through 2027. Glass Innovations fell 3% on lower TV and notebook volumes (call summary), with price increases starting in Q4 that mainly affect 2027.
Sources: Corning Exhibit 99.1; Investing.com call transcript summary.
Forensic #2: Core EPS Growth Of 36% Is Not Like For Like
GAAP EPS of $0.78 becomes core EPS of $0.91 through hedge and tax adjustments, and the 2025 base was calculated differently.
| Q3 2026 bridge, GAAP to core EPS | Per share |
|---|---|
| GAAP diluted EPS | $0.78 |
| Adjustment for hedged exposures (sales +$226M, operating income +$213M) | +$0.20 |
| Translated earnings contract gain (excluded from core, $138M pre-tax) | -$0.12 |
| Discrete tax items and other tax adjustments | +$0.05 |
| All other items (restructuring, pension, investments, legal, acquisition costs) | about $0.00 |
| Core EPS | $0.91 |
Source: Corning Exhibit 99.1, reconciliation of GAAP to core. The four lines sum to $0.91 with the other items rounding to zero.
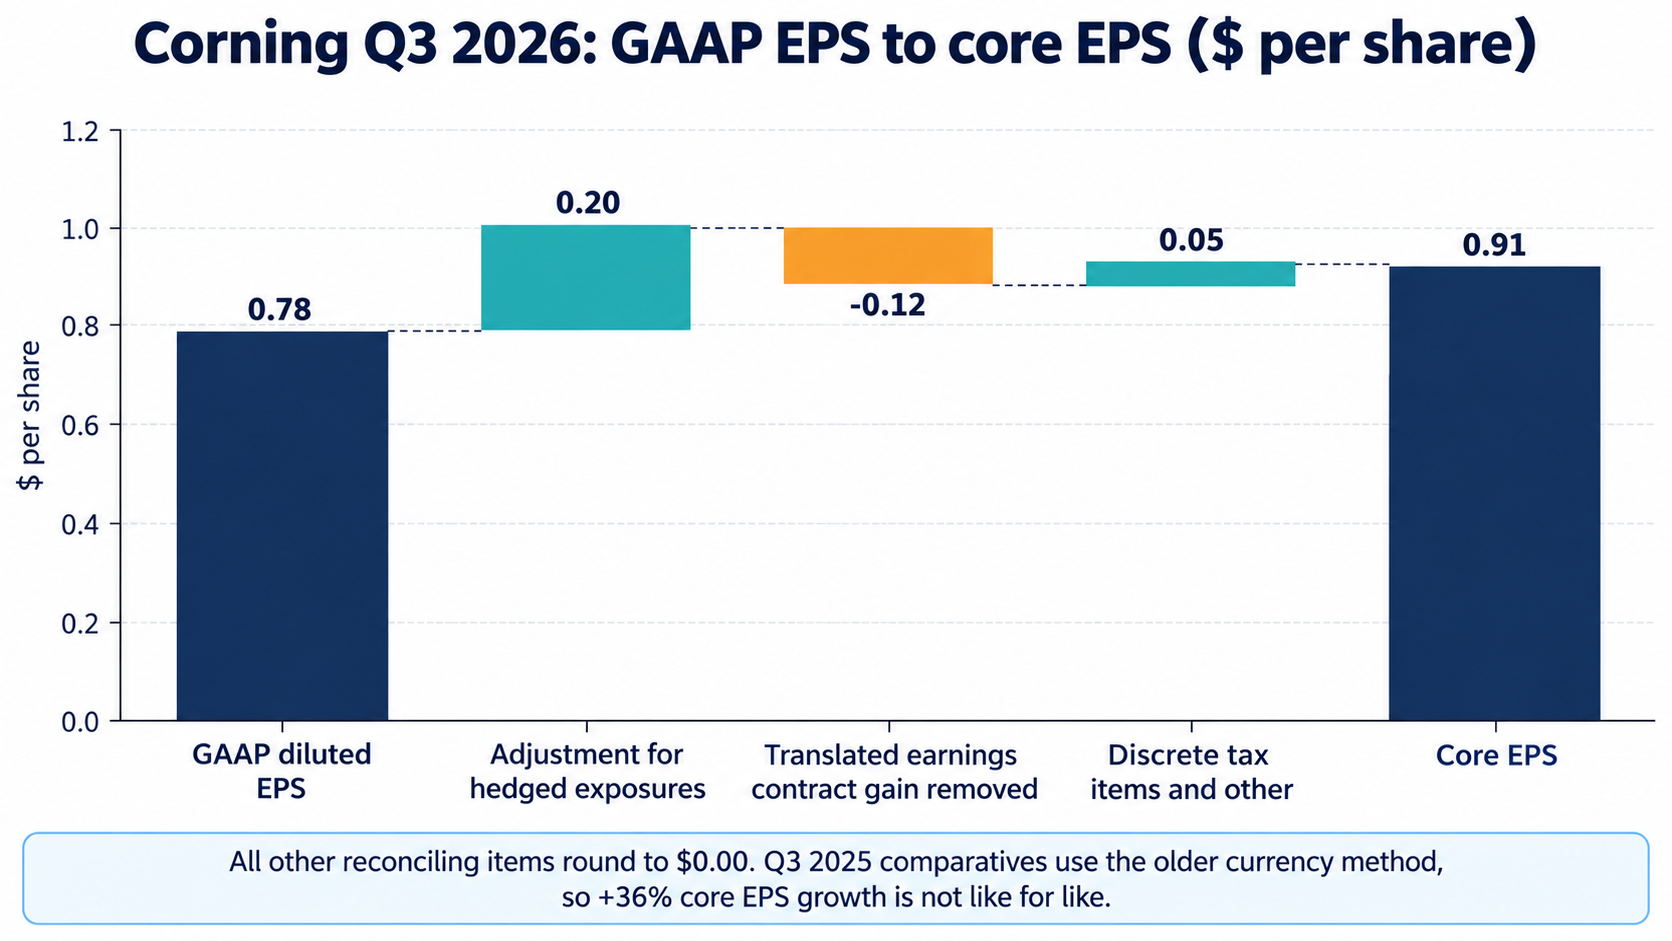
Q3 2026 Bridge From GAAP EPS To Core EPS (Self-Made)
The hedged-exposure adjustment adds $213M to operating income, 18% of core operating income of $1,152M (derived), and $226M to sales, 4.4% of core sales (derived). The release says the Q3 2025 comparatives use the older constant-currency method and that applying the new method would have produced higher 2025 comparisons. That means reported core growth of 19% in sales and 36% in EPS is higher than it would be on a consistent basis. The release does not give the restated 2025 figures.
GAAP growth has its own distortions. The GAAP tax rate was 22.9% against 14.5% a year ago, which held GAAP growth down, while the translated earnings contract gain of $138M against $33M helped it. GAAP SG&A fell 10% to $563M from $624M; the Q3 2025 reconciliation included $50M of litigation and $30M of acquisition-related items, and the release does not say which expense line each sat in.
Restructuring has an unexplained gap: the reconciliation shows a pre-tax restructuring charge of $8M but a $35M effect on operating income. The release does not explain the difference.
Sources: Corning Exhibit 99.1.
Forensic #3: $2.3B Of Free Cash Flow Includes $639M Of Customer Deposits And $423M Of Hedge Gains
Corning's adjusted free cash flow measure is larger than operating cash flow minus capex, and the gap is growing.
| Nine months ended Sept 30 | 2026 | 2025 | Change |
|---|---|---|---|
| Operating cash flow | $3,140M | $1,643M | +91% (d) |
| Capital expenditures | $1,299M | $850M | +53% (d) |
| Operating cash flow minus capex | $1,841M | $793M | +132% (d) |
| Realised gains on translated earnings contracts and other | $423M | $192M | +120% (d) |
| Adjusted free cash flow | $2,272M | $985M | +131% (d) |
| Customer deposits and government incentives, inside operating cash flow | +$639M | -$49M | $688M swing (d) |
| Adjusted free cash flow excluding deposits and hedge gains | about $1,210M | about $842M | +44% (d) |
(d) = derived. The $8M of government incentive proceeds is included in the 2026 remainder. The release labels the customer deposits line "operating" but the cash flow table in the release is partly garbled, so I used the reconciliation tables. Source: Corning Exhibit 99.1.
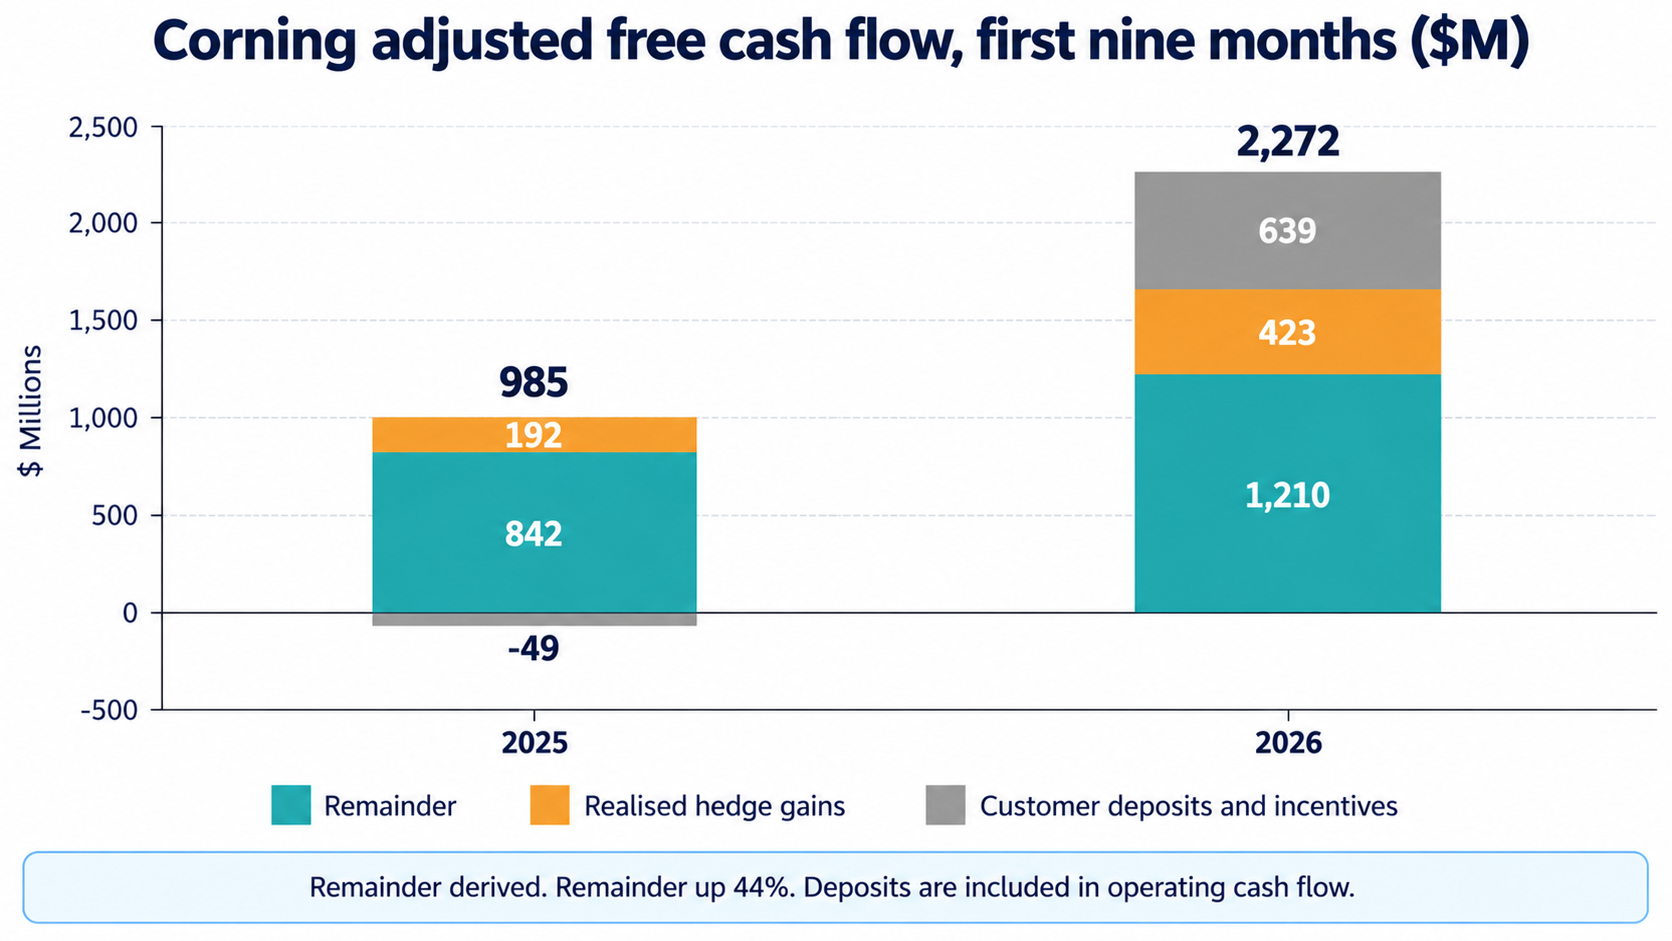
Nine-Month Adjusted Free Cash Flow By Source, 2026 vs 2025, $M (Self-Made)
Operating cash flow growth of 91% falls to 48% if the deposits line is removed from both years (derived). A call summary describes the deposits as a line in operating cash flow that nets upfront customer cash against cash returned as customers buy committed volume, so some of that cash is an advance rather than earnings. The same summary says management expects the customer agreements to help fund capex.
Corning also shows $500M of warrant proceeds in nine-month financing. I could not find an explanation in the sources I read. Cash rose to $2,537M from $1,526M at year end, total debt fell 2.8% to $8,200M, and net debt fell 18% to $5,663M (derived). Dividends paid were $757M and buybacks $158M, together 40% of nine-month adjusted free cash flow (derived).
Sources: Corning Exhibit 99.1; Investing.com call transcript summary.
Forensic #4: Capex Is Up 63% And Inventories Are Up 18.5%
Corning is spending ahead of demand, and the balance sheet shows the build.
| Balance sheet | Sep 30, 2026 | Dec 31, 2025 | Change |
|---|---|---|---|
| Cash and equivalents | $2,537M | $1,526M | +66% (d) |
| Trade receivables, net | $3,101M | $2,779M | +12% (d) |
| Inventories | $3,646M | $3,077M | +18.5% (d) |
| Property, plant and equipment, net | $15,517M | $14,825M | +4.7% (d) |
| Total assets | $34,126M | $30,976M | +10% (d) |
| Total debt | $8,200M | $8,434M | -2.8% (d) |
| Corning shareholders' equity | $13,671M | $11,807M | +16% (d) |
(d) = derived. Source: Corning Exhibit 99.1.
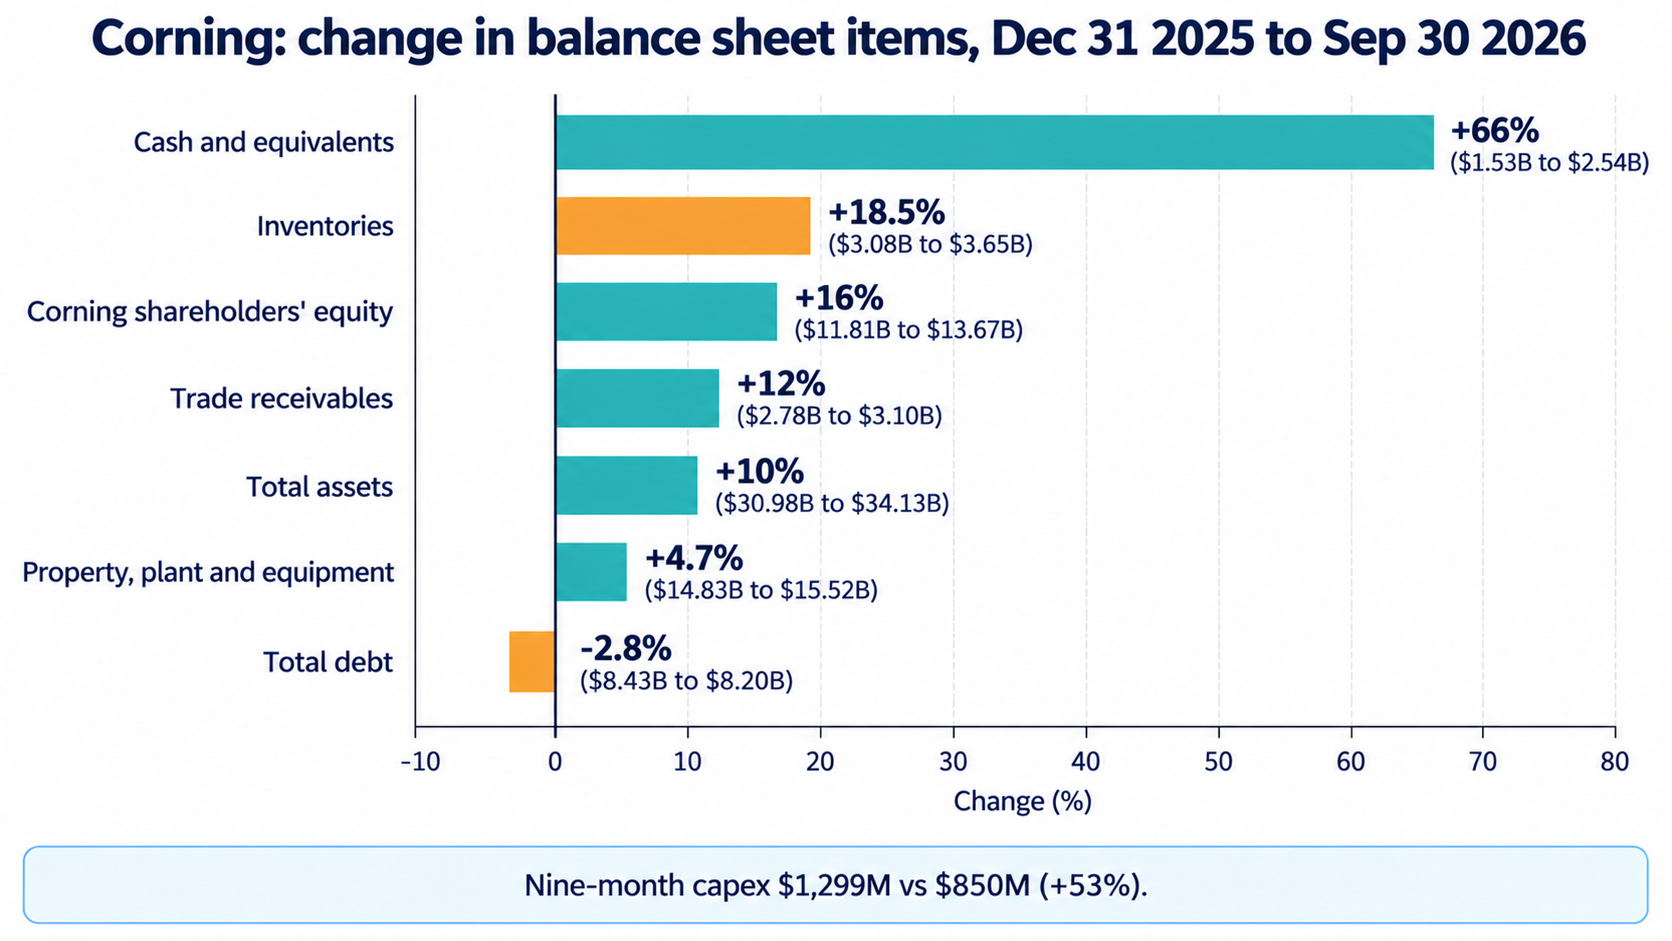
Corning Balance Sheet Changes From Dec 31, 2025 To Sep 30, 2026 (Self-Made)
Q3 capex of $545M was 51% of the quarter's operating cash flow of $1,061M, against 43% a year ago (derived). Management guides to about $2B for the year, mostly for Optical (call summary); nine-month capex was $1.3B, so Q4 capex would be about $0.7B (derived), higher than any quarter so far. Inventories rose 18.5% in nine months, close to the 19% year-over-year growth in core sales, so the build is not obviously ahead of sales, but the periods are not comparable. A 2027 capex figure is not stated.
The Springboard plan targets doubling the annual sales run rate from $20B to $40B by 2030, with earnings growing faster than sales. That needs about 19% annual growth from 2027 (call summary). A run rate of $20.3B in Q3 (core sales x 4, derived) means the first $20B target was met early. The plan carries a large capital cost, and the release gives no capex or free cash flow target to go with it.
Sources: Corning Exhibit 99.1; Investing.com call transcript summary.
Valuation Snapshot
At $127.74, Corning traded at about 38x the midpoint of 2026 core EPS implied by nine months plus Q4 guidance.
| Measure | At $127.74 (Oct 26 close) | At $122.80 (Oct 27 later quote) |
|---|---|---|
| Market capitalisation (871M diluted shares) | $111.3B | $107.0B |
| Enterprise value (plus net debt of $5.66B) | $116.9B | $112.6B |
| Price / 2026 core EPS ($3.36 to $3.40, midpoint $3.38) | 37.8x | 36.3x |
| Enterprise value / annualised Q3 core operating income ($4.61B) | 25.4x | 24.4x |
| Annualised nine-month adjusted free cash flow yield | 2.7% | 2.8% |
| Annualised Q3 dividend yield | 0.9% | 1.0% |
All ratios are derived. 2026 core EPS is nine-month core EPS of $2.40 plus the Q4 guide of $0.96 to $1.00. The share count is Q3 weighted diluted shares, not shares outstanding. Enterprise value excludes the $617M non-controlling interest. The free cash flow yield uses Corning's adjusted measure ($2,272M x 12 / 9), which includes the deposits and hedge gains in Forensic #3; the like-for-like figure would be lower. Annualising a quarter or nine months ignores seasonality.
Investing.com cites a trailing GAAP P/E near 59 for the stock. That is a different basis from the core multiple above, and shows how much of the valuation depends on which earnings measure is used.
Risks: What Would Break The Thesis
The concern is concentration and cash conversion. These are the facts that would show it is wrong, or worse.
- Optical slows. With 90% of sales growth and 60% of segment profit in one segment, any slowdown in Gen AI or Enterprise Networks orders shows up in group numbers immediately.
- Capex outruns returns. About $2B this year and no 2027 figure. If customer funding does not cover it, free cash flow falls while Springboard needs more capacity.
- Core growth looks lower on a consistent basis. The 2025 comparatives use the older method, so quarterly growth may normalise once both periods use the new one.
- Deposits unwind. The $639M of customer deposits is cash received in advance. If customers take delivery, it stops adding to operating cash flow.
- Solar and Glass. Solar lost $7M despite 37% sales growth and Glass Innovations profit fell 10%. Both would need to recover to lift the other 53% of sales.
- Valuation. At about 38x core EPS the stock needs the 20-30-40 plan to deliver. The Q4 guide implies only 5% to 10% sequential EPS growth (derived).
What To Watch Next
- Q4 results and 2027 outlook. Core EPS against $0.96 to $1.00, and any 2027 capex and free cash flow guidance.
- Restated core comparisons. Whether Corning publishes 2025 on the new hedged-exposure method.
- Optical disclosure. Dollar sales for Enterprise Networks and Gen AI products, and Optical net margin against the low 20s level.
- Customer deposits. The balance of deposits and how much is applied to deliveries each quarter.
- Solar ramp. A move from a $7M loss to profit and progress against the "more than $3 billion" revenue goal.
- Inventory. Whether inventories grow slower than sales at year end.
- Conference. The UBS Global Technology and AI Conference on Dec 1, 2026, which the release lists.
Sources And Data Notes
Financial figures come from Corning's Q3 2026 results release (Exhibit 99.1 to Form 8-K), filed Oct 27, 2026 before the open. Prices are from Oct 26 and Oct 27 and will have moved. I did not read Corning's Form 10-Q.
Primary sources
- Corning Q3 2026 results, Exhibit 99.1 to Form 8-K, Oct 27, 2026
Secondary sources
- Investing.com call transcript summary: capex guidance, customer deposits, Springboard progress, Solar and Glass commentary, price quotes
- Investing.com slides summary: consensus, 52-week high, trailing P/E (marked as AI-generated and editor-reviewed by the site)
- 247wallst: EPS consensus and segment summary
- TradingKey and Yahoo Finance: Oct 28 move and one-month performance
Marked, not independently confirmed
- The 2026 capex guide of about $2B, the $20.3B run rate, the 19% growth plan from 2027, TV and notebook volume declines and the Solar and Glass commentary come from a call summary, not the release.
- The 52-week high of $271.78 and the trailing P/E near 59 come from a single secondary source.
Where sources disagree
- Revenue versus estimate: 247wallst reports $4.86B (GAAP) against a $5.03B estimate, a miss, while Investing.com reports $5.08B (core) against $5.03B, a beat. The estimate appears to be on the core basis, so I compare it with core sales.
- Oct 27 price: $123.94 premarket (down 2.97%), $124.50 (down 2.54%) and $122.80 (down 3.87%), all against the $127.74 close. Oct 28: +3.42% (TradingKey) versus about -1.1% (Yahoo).
- The release's cash flow table has garbled Q3 2025 columns. Segment net income totals $892M, which does not tie to GAAP net income of $680M, and the Q3 2025 EPS items sum to about $0.69 against reported core EPS of $0.67 (rounding).
Left out
- A per-share dividend, which the release does not state, and any claim about the source of the $500M warrant proceeds.
- A 2027 capex figure, which is not in the sources.
Derived figures are my arithmetic from the release and are marked (d), "derived" or "my arithmetic".

Sandeep Gupta
Independent equity research analyst publishing forensic theses on US-listed stocks. MBA, Politecnico di Milano School of Management (Milan, Italy).
Get new research in your inbox
Subscribe to receive forensic equity research the moment it's published. Free, no spam.
Discussion
Be the first to comment.