
Investment Thesis
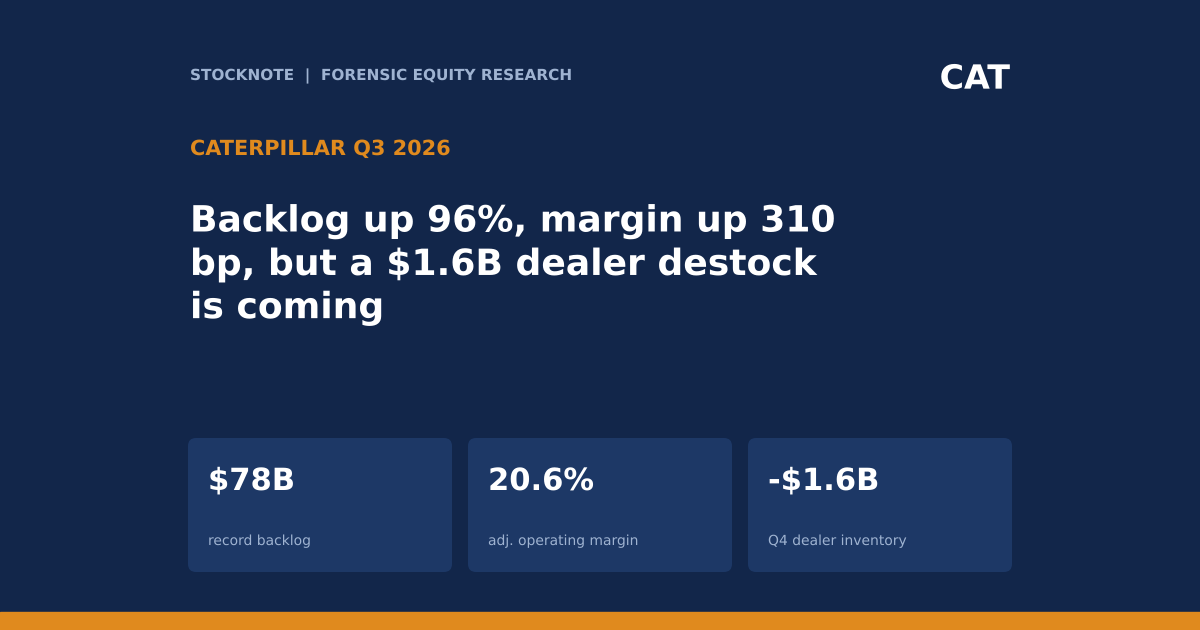
Caterpillar's third quarter was strong: sales rose 17%, adjusted operating margin rose 310 basis points to 20.6%, and backlog nearly doubled to a record $78B. The same call also set out a planned $1.6B reduction in Construction Industries dealer inventory in Q4, about $2.2B of tariff costs for the year, and a share count that added about $0.15 to adjusted earnings per share.
- Earnings. Sales and revenues were $20.7B (+17%). Adjusted profit per share was $7.20 (+45%) and profit per share was $7.13. Adjusted operating profit was $4.3B (+38%).
- Margin. Adjusted operating margin was 20.6%, up 310 basis points, which by my arithmetic compares with about 17.6% a year ago (d).
- Backlog. A record $78B, up about $38B or 96% from last year, against sales growth of 17%.
- Segments. Power & Energy sales rose 18% and profit 31%, Construction Industries sales 18% and profit 33%, Resource Industries sales 15% and profit 14%. Margins were 24.4%, 22.9% and 13.5%.
- Tariffs. Tariff costs excluding IEEPA recoveries were about $600M in Q3, roughly flat year over year, with $128M of IEEPA tariff recoveries. Full-year tariff costs are about $2.2B, excluding about $520M of year-to-date recoveries.
- Q4 setup. Management expects Construction Industries dealer inventory to fall about $1.6B in Q4 against a $600M decline a year ago, a headwind of roughly $1B. Q4 sales are guided to moderate growth, and the full-year adjusted margin to the bottom of the target range, excluding IEEPA recoveries.
- Cash and returns. MP&E free cash flow was $3.8B (+about $600M). Shareholder returns were $2B, $1.2B of buybacks and nearly $750M of dividends, about 53% of free cash flow (d).
- This article contains no price target or rating. Every figure comes from the executives' spoken remarks on the Q3 call or a named source, and anything I calculated is marked (d).
Bottom line. Q3 shows Caterpillar at peak-like conditions: a record backlog, a 20.6% adjusted margin and $7.20 of adjusted EPS. The investor question is how much carries into Q4 and 2027. Management's own commentary points to a softer Q4 because of the dealer destock, a full-year margin guide at the bottom of the target range, and about $2.2B of annual tariff costs.
Source: Caterpillar Q3 2026 earnings call transcript, Motley Fool, Oct 29, 2026.
Q3 2026 At A Glance
Growth was broad, and profit grew faster than sales in the two largest segments.
| Metric (Q3 2026) | Q3 2026 | Change | Prior year (d) |
|---|---|---|---|
| Sales and revenues | $20.7B | +17% | about $17.7B |
| Adjusted operating profit | $4.3B | +38% | about $3.1B |
| Adjusted operating margin | 20.6% | +310 bp | about 17.6% |
| Adjusted profit per share | $7.20 | +45% | about $4.97 |
| Profit per share (GAAP basis) | $7.13 | n/a | n/a |
| Backlog | $78B (record) | +$38B (+96%) | about $40B |
| Power & Energy sales / profit | $8.8B / $2.1B | +18% / +31% | 24.4% margin, +250 bp |
| Construction Industries sales / profit | $8.0B / $1.8B | +18% / +33% | 22.9% margin, +250 bp |
| Resource Industries sales / profit | $4.6B / $622M | +15% / +14% | 13.5% margin, flat |
| Financial Products revenue / profit | $1.2B / $264M | +9% / +10% | past dues 1.31% |
| MP&E free cash flow | $3.8B | +about $600M | n/a |
| Enterprise cash | $7.9B plus $1.6B securities | n/a | n/a |
(d) = derived by me by backing the stated growth rates out of the stated figures, so prior-year values are approximate. Source: Caterpillar Q3 2026 call transcript.
What The Market Believes vs. What The Data Actually Shows
The popular view is that Caterpillar is a clean beneficiary of data-center power demand. The numbers support the demand, but they also show timing items that will matter in Q4.
| Claim | What the call numbers show |
|---|---|
| Power demand is surging | Power & Energy sales to users rose 36%, with power generation up 75% and oil and gas up 5%. |
| Growth is broad | Construction Industries sales to users rose 20% (North America +27%), but Resource Industries sales to users rose only 4%. |
| Margin expansion is structural | Full-year adjusted margin is guided to the bottom of the target range, excluding IEEPA recoveries, despite a 20.6% Q3. |
| Tariffs are fading | Full-year tariff costs are about $2.2B, and Q4 is about $600M, which is roughly $200M lower than Q4 2025. |
| Earnings per share growth is operating | About $0.15 of the $7.20 came from a lower share count. |
The call gave no consensus figures; prices are in the Valuation Snapshot.
The market narrative treats Caterpillar as a data-center power story. The call supports that for Power & Energy, but that segment is about 41% of segment sales ($8.8B of $21.4B, d) and the more cyclical Construction Industries is another 37%. A balanced view needs both, and Resource Industries, with the lowest margin, is the one where end demand is weakest.
Forensic #1: Profit Grew Faster Than Sales In The Two Biggest Segments
Construction Industries profit grew 33% on 18% sales growth, and Power & Energy profit grew 31% on 18%. Resource Industries and Financial Products profit grew about as fast as sales.
| Segment | Sales | Sales growth | Profit | Profit growth | Margin |
|---|---|---|---|---|---|
| Construction Industries | $8.0B | +18% | $1.8B | +33% | 22.9% |
| Power & Energy | $8.8B | +18% | $2.1B | +31% | 24.4% |
| Resource Industries | $4.6B | +15% | $622M | +14% | 13.5% |
| Financial Products | $1.2B | +9% | $264M | +10% | n/a |
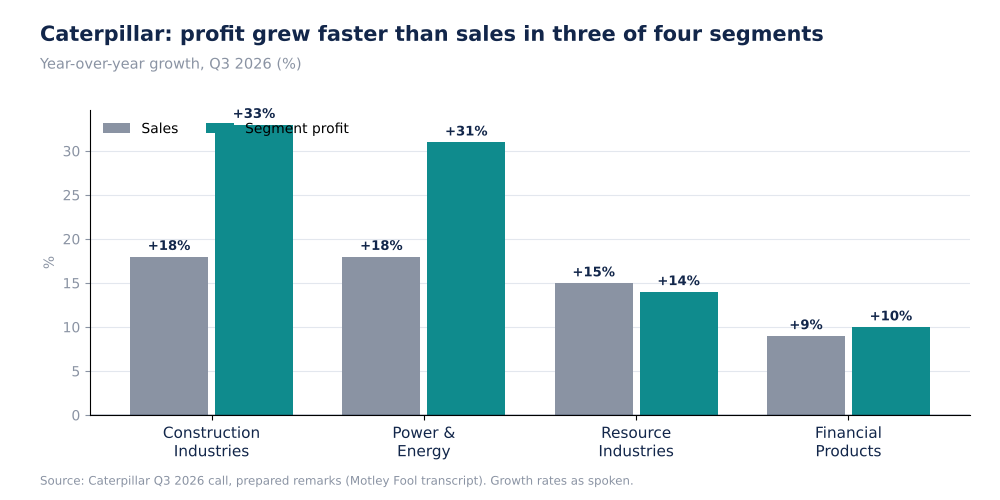
Caterpillar Q3 2026 Segment Sales Growth vs Segment Profit Growth (Self-Made)
The three industrial segments' sales add to $21.4B, above consolidated sales of $20.7B, so the call figures include intersegment items that I cannot separate (d). Segment profits of the four segments total about $4.8B (d), against adjusted operating profit of $4.3B, so corporate and other items also sit between the two.
Why it matters. Incremental margin shows how much operating leverage the business has. Adjusted operating profit rose about $1.2B on about $3.0B of extra sales (d, from the stated growth rates), an incremental margin of about 39%, roughly double the 20.6% average. That is a sign of strong pricing and volume leverage, and it also means profit is sensitive when volume or dealer stocking turns.
Source: Caterpillar Q3 2026 call transcript.
Forensic #2: Sales To Users Moved Differently From Caterpillar's Own Sales
Caterpillar reports its own sales to dealers and, separately, dealers' sales to end users. The two diverged in two segments.
| Segment | Caterpillar sales growth | Sales to users growth | Gap |
|---|---|---|---|
| Construction Industries | +18% | +20% | +2 pts (d) |
| Power & Energy | +18% | +36% | +18 pts (d) |
| Resource Industries | +15% | +4% | -11 pts (d) |
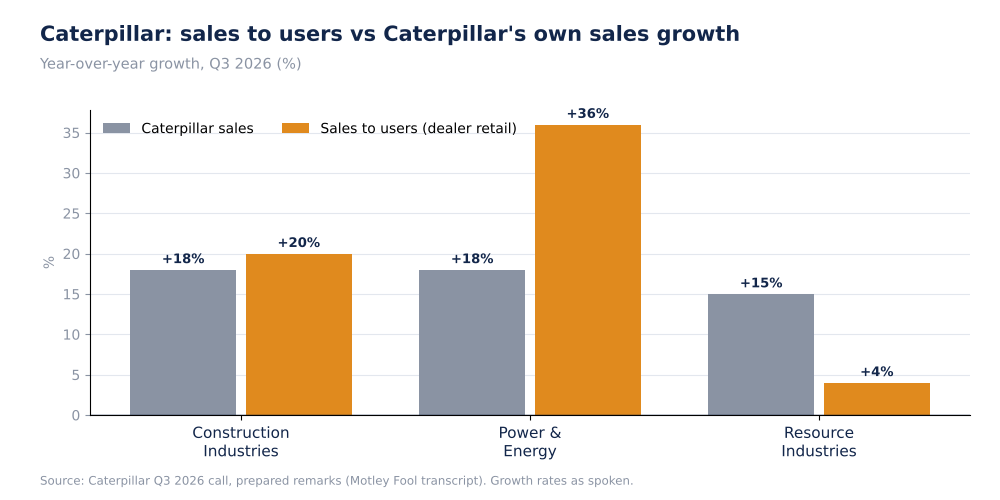
Caterpillar Sales Growth vs Sales To Users Growth By Segment, Q3 2026 (Self-Made)
Power & Energy end-user demand grew twice as fast as Caterpillar's own sales. For Resource Industries the order is reversed, with Caterpillar's sales growing well ahead of end-user sales. The call does not explain either gap, so I treat them as facts to watch, not conclusions.
Why it matters. Sales to users measure end demand, while Caterpillar's own sales also depend on what dealers choose to stock. Power & Energy end demand grew twice as fast as Caterpillar's shipments, which fits a supply-constrained business with a backlog that nearly doubled, though the call did not say this directly, so treat it as an inference. Resource Industries shows the opposite pattern, and its 13.5% margin is the lowest of the three.
Source: Caterpillar Q3 2026 call transcript.
Forensic #3: A $1.6B Dealer Destock Is Planned For Q4
Construction Industries dealer inventory rose $300M in Q3 2026, against a $600M rise in Q3 2025. For Q4, management expects a reduction of roughly $1.6B against a $600M reduction a year earlier.
| Construction Industries dealer inventory | Change |
|---|---|
| Q3 2025 | +$600M |
| Q3 2026 | +$300M |
| Q4 2025 | -$600M |
| Q4 2026 (management expectation) | about -$1.6B |
| Q4 year-over-year swing (d) | about -$1.0B, which management called a volume headwind |
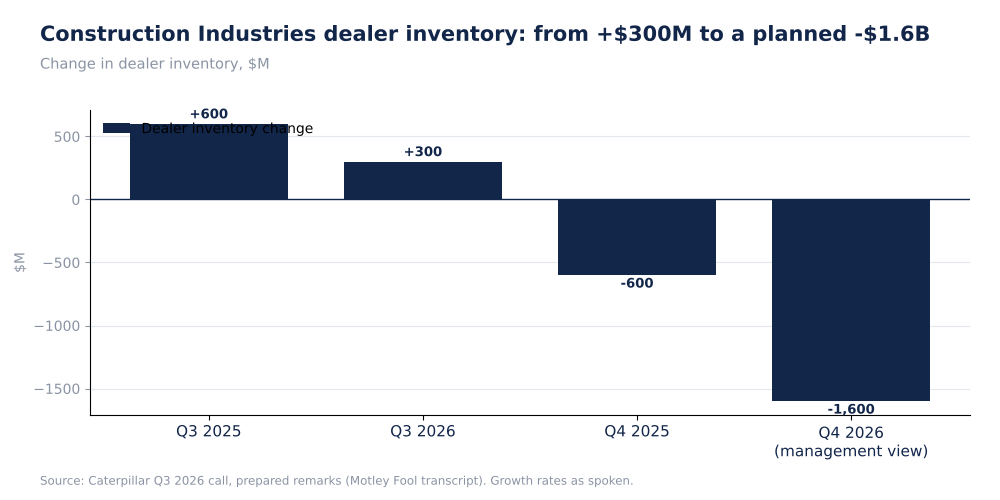
Caterpillar Construction Industries Dealer Inventory Change, $M (Self-Made)
Q4 sales are guided to moderate growth year over year despite this headwind. Other items named for Q4 are tariff costs about $200M below last year and a record backlog, but management did not quantify how the pieces net.
Why it matters. A dealer destock is a timing effect, not a change in end demand, but it still lowers Caterpillar's reported sales and the absorption of fixed costs in the quarter it happens. The roughly $1B year-over-year swing is about 5% of Q3 sales (d), which is large against guided moderate growth. Investors should look through it only if sales to users stay strong.
Source: Caterpillar Q3 2026 call transcript.
Forensic #4: Tariff Recoveries, Buybacks And What Sits Inside The Margin
Three items affect how Q3 earnings should be read.
| Item | Amount | Why it matters |
|---|---|---|
| IEEPA tariff recoveries (Q3) | $128M | About 3% of the $4.3B adjusted operating profit (d), if included in it |
| IEEPA recoveries (year to date) | about $520M | The full-year margin guide is stated excluding these |
| Tariff costs excluding recoveries (Q3) | about $600M | Roughly flat year over year; 2.9% of sales (d) |
| Share-count benefit to adjusted EPS | about $0.15 | About 2% of $7.20 (d) |
| Effective tax rate | 23% | As stated on the call |
The transcript says the full-year margin guide excludes IEEPA recoveries, which suggests recoveries are inside reported results, but it does not state whether the $128M is inside the $4.3B adjusted operating profit, so I leave that open.
Why it matters. These items decide how much of the 20.6% margin is repeatable. Tariff recoveries depend on policy, buybacks lift per-share figures but not operating profit, and tariff costs of about $2.2B for the year are a standing cost the margin already carries. A reader should discount the Q3 margin for items that may not recur.
Source: Caterpillar Q3 2026 call transcript.
Valuation Snapshot
TradingView shows Caterpillar at $622.75 with a market cap of about $286.3B and a P/E of 25.4. Its key facts say the stock fell about 3.1% to $627.39 on Oct 30, a figure that does not match the headline price, so I treat the price as approximate.
| Measure | Figure |
|---|---|
| Share price (TradingView) | $622.75 |
| Market cap (TradingView) | about $286.3B |
| P/E, trailing (TradingView) | 25.4 |
| Price / annualised Q3 adjusted EPS of $28.80 (d) | about 21.6x |
| Full-year MP&E free cash flow guide, top half of $6B to $15B | $10.5B to $15B, or 3.7% to 5.2% of market cap (d) |
| Annualised Q3 shareholder deployment of $8B (d) | about 2.8% of market cap |
The price already capitalises record earnings. Annualised Q3 adjusted EPS is a high-water mark, because Q4 faces a $1.6B dealer destock and the full-year margin guide is the bottom of the target range.
What has to be true. At about 22 times annualised Q3 adjusted EPS, investors are paying for earnings to hold near the Q3 level. With Q4 guided to moderate sales growth, a full-year margin at the bottom of the target range and a $1.6B destock, the near-term evidence points to a flat-to-lower quarterly run-rate, so the valuation depends on the backlog converting into 2027 sales.
Risks: What Would Break The Thesis
- Dealer destock is larger. A $1.6B Q4 reduction is already expected; anything deeper would hit sales and margin.
- Power demand slows. Power generation sales to users rose 75%; a fall in data-center orders would hit the backlog's conversion.
- Resource Industries gap. Sales to users grew 4% against 15% sales growth.
- Tariffs. About $2.2B for the year; policy changes could move it either way.
- Data limits. I did not read the SEC filing or the Q&A in detail.
The sharpest risk is timing: the Q4 destock and tariff costs land together. The longer-term risk is that backlog growth is concentrated in power generation, where sales to users rose 75%. If that demand normalises, the doubling of the backlog is the number that would reverse.
What To Watch Next
- Q4 Construction Industries dealer inventory against the $1.6B expectation.
- Whether Power & Energy sales close the gap with 36% sales-to-users growth.
- Resource Industries sales to users, now +4%.
- Backlog after $78B and its conversion to sales.
- Full-year adjusted operating margin against the bottom of the target range.

Sandeep Gupta
Independent equity research analyst publishing forensic theses on US-listed stocks. MBA, Politecnico di Milano School of Management (Milan, Italy).
Get new research in your inbox
Subscribe to receive forensic equity research the moment it's published. Free, no spam.
Related Research
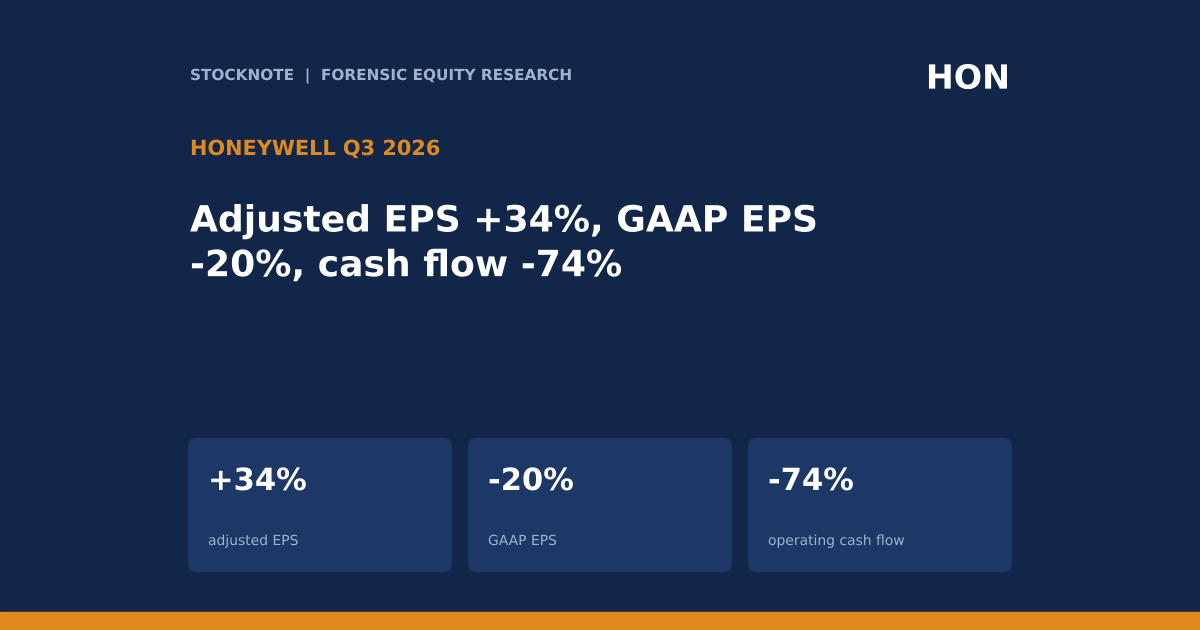 HON
Honeywell (HON): Adjusted EPS Up 34%, GAAP EPS Down 20%, And Operating Cash Flow Down 74%
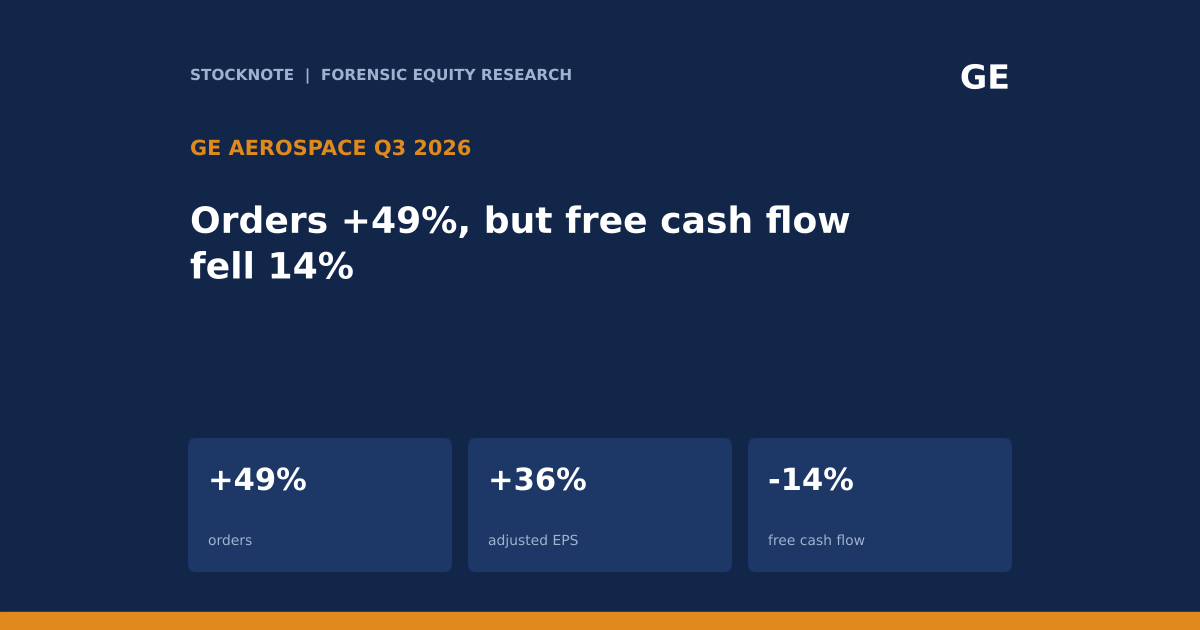 GE
GE Aerospace (GE): Orders Up 49% And Adjusted EPS Up 36%, But Free Cash Flow Fell 14% And The Guide Implies A Softer Q4
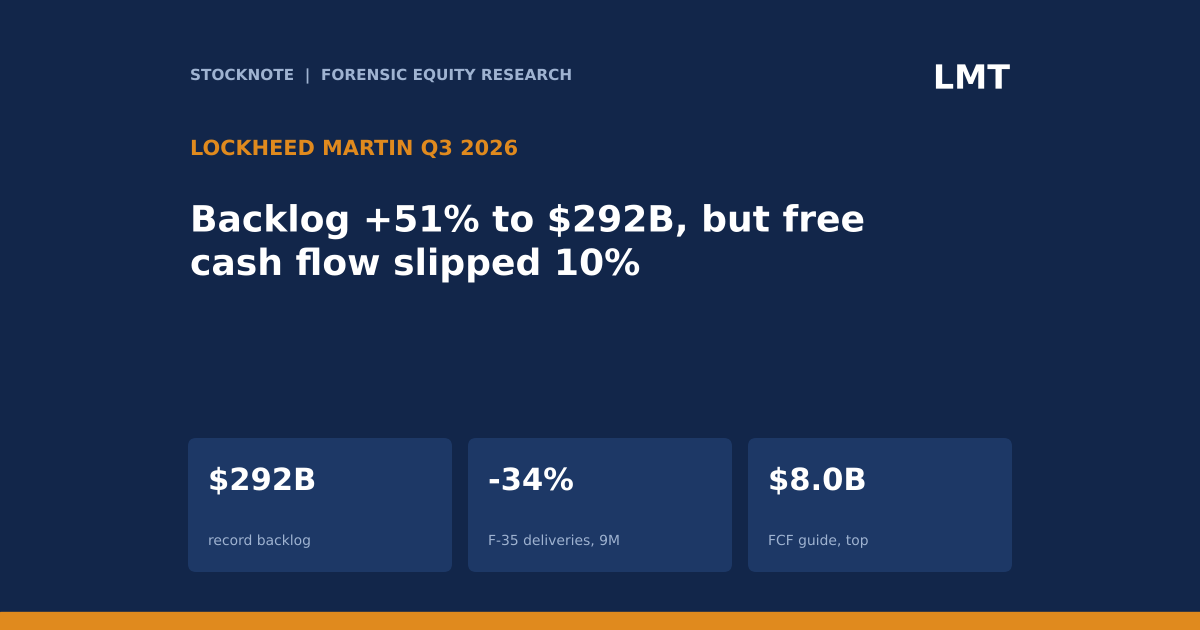 LMT
Lockheed Martin (LMT): Backlog Up 51% To $292B On A Missile Award, But F-35 Deliveries Fell And Free Cash Flow Slipped 10%
Latest earnings releases: CAT
— Caterpillar Reports Third-Quarter 2026 Results
Discussion
Be the first to comment.