
Investment Thesis
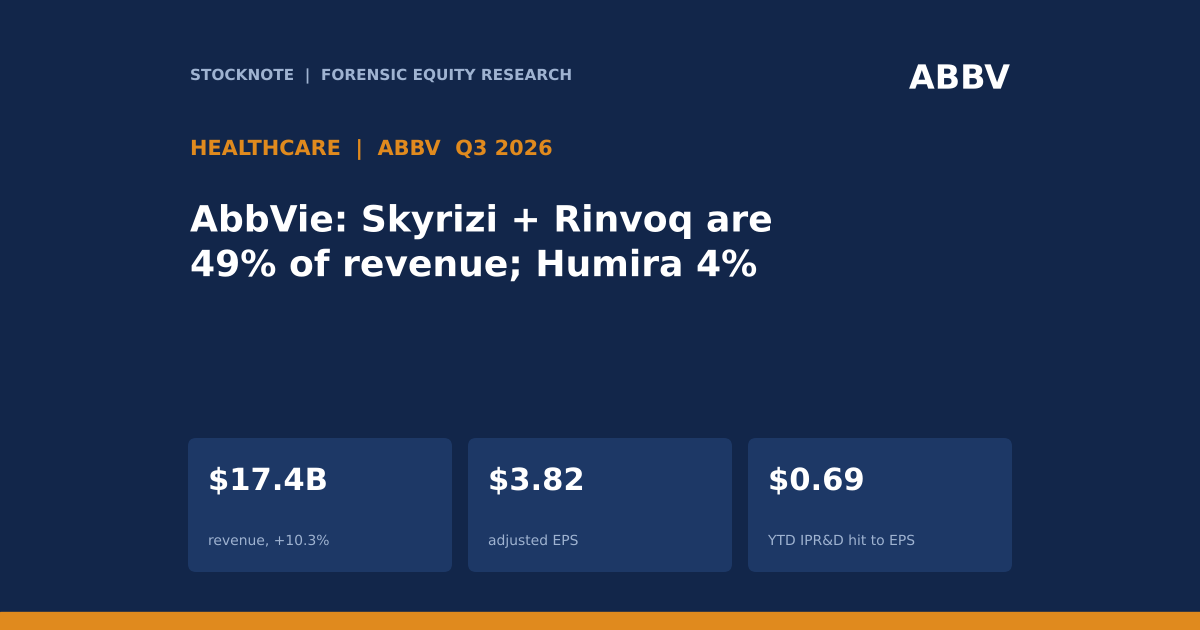
AbbVie's third-quarter 2026 net revenues were $17.404 billion, up 10.3%, with adjusted diluted EPS of $3.82 (against $1.86 a year earlier, +105%, d) and GAAP EPS of $2.37 (against $0.10). The company raised its 2026 adjusted EPS guidance to $13.95 to $13.99. The quarter shows two things that matter beyond one company. First, a drug maker's revenue growth can come almost entirely from two successor products while the old franchise declines, a pattern that is the core of patent-expiry analysis. Second, adjusted EPS is a company-defined number: AbbVie includes acquired in-process R&D (IPR&D) in its adjusted figure, which cost $0.11 in the quarter and $0.69 year to date, and that affects comparisons across the sector. FactSet reports that the Pharmaceuticals industry's earnings fell 17% this season and drove the only decline among S&P 500 sectors (Health Care -1.2%).
- Revenue. $17.404B (+10.3% reported, +10.5% operational). Skyrizi $5.776B (+22.7%); Rinvoq $2.706B (+23.9%); Humira $683M (-31.2%).
- EPS. GAAP diluted $2.37 (Q3 2025: $0.10); adjusted diluted $3.82 ($1.86).
- Margin. Operating margin 36.0% GAAP; 48.7% adjusted.
- IPR&D. Acquired IPR&D and milestones expense of $216M pre-tax ($205M after tax), 1.2% of revenue, an unfavourable $0.11 per share on both GAAP and adjusted EPS.
- Guidance. 2026 adjusted EPS raised from $13.76-$13.96 to $13.95-$13.99, including an unfavourable $0.69 per share from IPR&D and milestones incurred through Q3, and excluding any such expense after Q3.
- This article contains no rating, price target or investment advice. Every figure comes from a named source and anything I calculated is marked (d).
Bottom line. Skyrizi and Rinvoq together are $8.482B, or 48.7% of revenue (d), and added about $1.59B of revenue over the year (d, approximate), which is about 98% of the company's total revenue increase of roughly $1.63B (d). Humira lost about $0.31B (d). The growth is therefore concentrated in two products, and the rest of the portfolio grew about 4% in aggregate (d). The upside is that the transition is working; the risk is that the company's growth now depends on two assets, and on how long their exclusivity lasts, which the release does not address.
Sources: AbbVie Q3 2026 results; FactSet Earnings Insight, Oct 23, 2026. Derived items are marked (d).
Q3 2026 At A Glance
| Metric | Q3 2026 | Change |
|---|---|---|
| Net revenues | $17.404B | +10.3% reported; +10.5% operational |
| Skyrizi | $5.776B | +22.7% |
| Rinvoq | $2.706B | +23.9% |
| Humira | $683M | -31.2% |
| GAAP diluted EPS | $2.37 | vs $0.10 in Q3 2025 |
| Adjusted diluted EPS | $3.82 | vs $1.86 (+105%, d) |
| GAAP / adjusted operating margin | 36.0% / 48.7% | n/a |
| Acquired IPR&D and milestones | $216M pre-tax | $0.11 per share |
Source: AbbVie. Derived growth is my arithmetic (d).
What The Market Believes vs. What The Data Actually Shows
| Belief | What the data show |
|---|---|
| AbbVie is a Humira company | Humira was $683M, 3.9% of revenue (d), and is falling 31.2%; Skyrizi and Rinvoq are 48.7% (d). |
| Revenue growth is broad | About 98% of the year's revenue increase came from Skyrizi and Rinvoq (d); the rest of the portfolio grew about 4% (d). |
| Adjusted EPS shows underlying earnings | It excludes a $1.45 per share gap to GAAP (d), but it includes IPR&D, which cost $0.11 in Q3 and $0.69 year to date. |
| Pharma earnings are collapsing | FactSet has the industry at -17% this season, but AbbVie's adjusted EPS grew 105% (d), so the industry figure depends on individual companies' treatment of charges and the extract does not say which companies are behind it. |
| Guidance was cut by IPR&D | Guidance was raised to $13.95-$13.99 from $13.76-$13.96; the midpoint rose $0.11 (d), while the year-to-date IPR&D impact is $0.69. |
The fourth row is a caution against inferring causes. FactSet attributes the Health Care sector decline to the Pharmaceuticals industry (-17%), but does not name companies in the text I read, and I did not retrieve results for other drug makers in time for this article. AbbVie is one data point and it points the other way.
Forensic #1: The Revenue Transition
| Product | Q3 2026 | Growth | Approx. prior-year revenue (d) | Approx. change (d) |
|---|---|---|---|---|
| Skyrizi | $5.776B | +22.7% | $4.71B | +$1.07B |
| Rinvoq | $2.706B | +23.9% | $2.18B | +$0.52B |
| Humira | $0.683B | -31.2% | $0.99B | -$0.31B |
| Skyrizi + Rinvoq | $8.482B | n/a | $6.89B | +$1.59B |
| All other (d) | $8.239B | about +4% | $7.89B | +$0.34B |
| Total | $17.404B | +10.3% | $15.78B | +$1.63B |
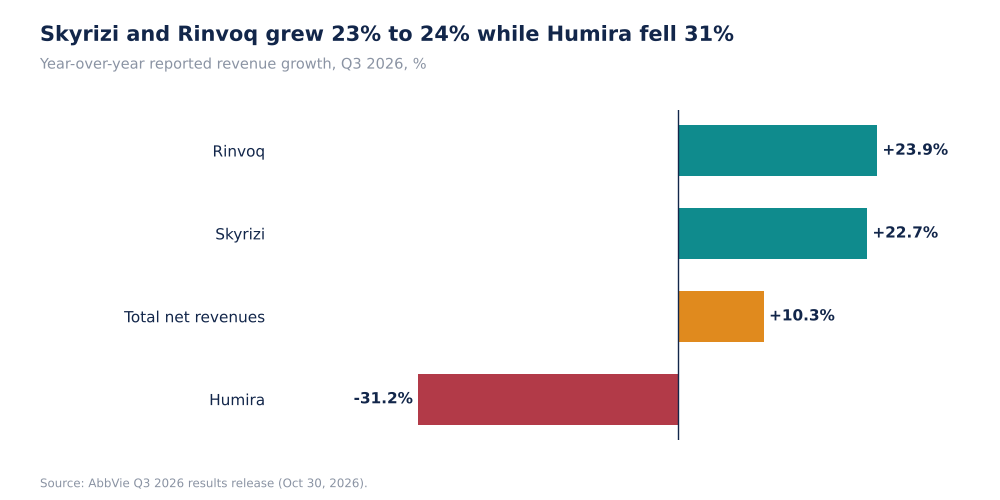
AbbVie Q3 2026 Revenue Growth By Product, % (Self-Made)
The prior-year figures are backed out of rounded growth rates, so they are approximate to about $0.01B. The "all other" row is the residual after the three named products ($17.404B - $9.165B = $8.239B, d). The effect of the transition is visible in the arithmetic: Skyrizi and Rinvoq added about $1.59B and Humira gave back $0.31B, a net gain of $1.28B (d) from the three products, which means the remaining $0.34B of growth in the rest of the portfolio is only about a fifth of the total increase (21%, d).
Why it matters. Franchise replacement is the central question for any drug maker facing generic or biosimilar competition. The numbers show the replacement is more than complete in dollars. They also show that further growth depends on the two replacement products continuing at 23% to 24% growth, because Humira's decline now subtracts only about $0.31B a year (d), too little to offset a slowdown in the two successors.
Source: AbbVie. Prior-year values and changes are my arithmetic from rounded growth rates (d).
Forensic #2: Concentration
| Component | Share of Q3 revenue (d) |
|---|---|
| Skyrizi | 33.2% |
| Rinvoq | 15.5% |
| Humira | 3.9% |
| All other products | 47.3% |
| Skyrizi + Rinvoq | 48.7% |
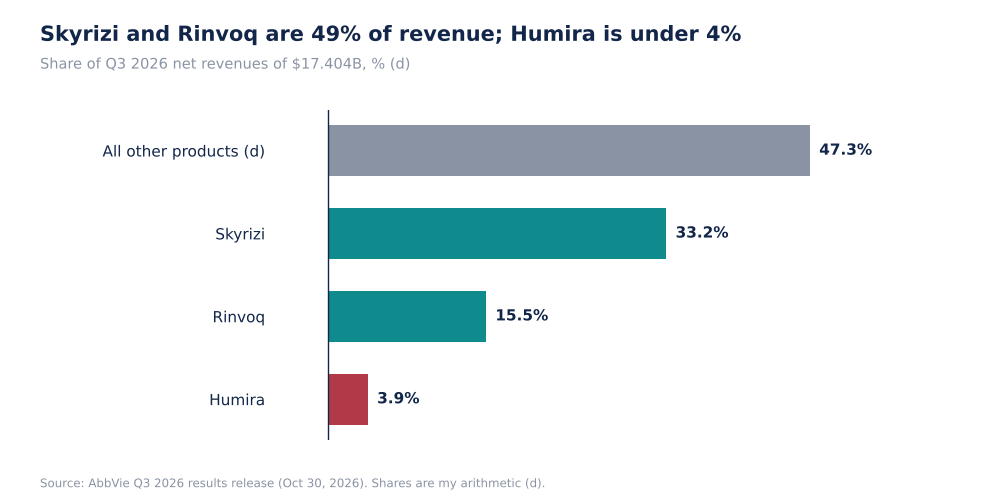
Share Of Q3 2026 Revenue, % (Self-Made, d)
Two products supply nearly half of revenue. Skyrizi alone is about a third (33.2%, d), and its quarterly revenue of $5.776B is more than eight times Humira's $683M (d: 8.5 times). Concentration is not unusual in the industry, but it means that growth and valuation for the company depend on the durability of those two assets, such as patent timing, competition, pricing and coverage, none of which the Q3 release extract discusses.
Why it matters. The same concentration that produces 10% growth also produces event risk. A single clinical, legal or reimbursement development in one product affects a third of revenue.
Source: AbbVie. Shares are my arithmetic (d).
Forensic #3: GAAP Versus Adjusted Earnings
| EPS and margin | GAAP | Adjusted | Gap (d) |
|---|---|---|---|
| Q3 2026 diluted EPS | $2.37 | $3.82 | $1.45 |
| Q3 2025 diluted EPS | $0.10 | $1.86 | $1.76 |
| Q3 2026 operating margin | 36.0% | 48.7% | 12.7 points |
| Adjustments as % of adjusted EPS, Q3 2026 (d) | n/a | n/a | 38% |
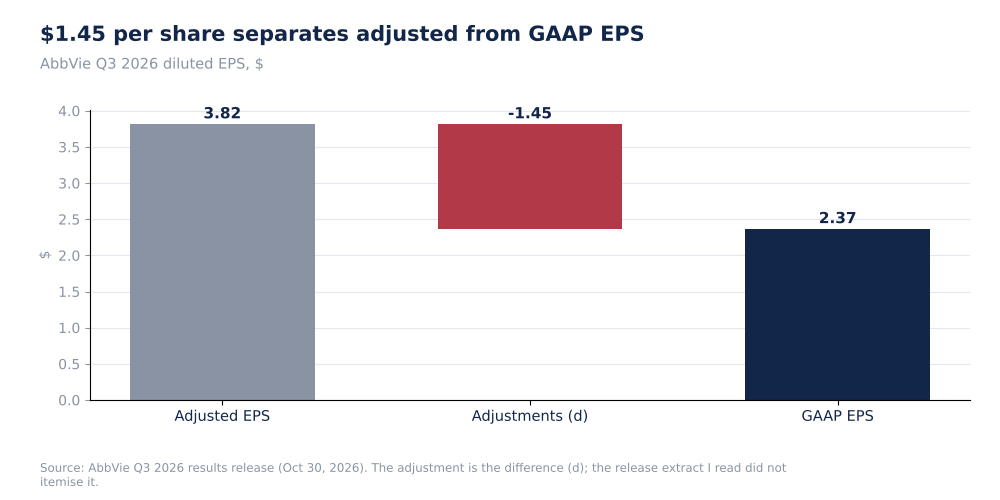
AbbVie Q3 2026 EPS, Adjusted To GAAP, $ (Self-Made)
The gap between adjusted and GAAP EPS was $1.45 in Q3 2026 and $1.76 a year earlier (d), or 38% of adjusted EPS this year (d). The release extract I read does not itemise the adjustments, so I cannot say what they were; adjusted measures commonly exclude items such as the amortisation of acquired intangible assets, but I did not confirm AbbVie's list. The GAAP EPS growth is therefore much larger than the adjusted growth (+2,270%, from $0.10, d), driven by a smaller gap, not a fundamental acceleration. The important disclosed item is IPR&D, which stays inside AbbVie's adjusted EPS.
Why it matters. A reader comparing adjusted EPS across drug makers has to check each company's treatment of acquired IPR&D, because a company that excludes it would show higher adjusted EPS than one that includes it, for the same economics. AbbVie's inclusion lowers its 2026 guidance by $0.69 a share through Q3 (about 4.9% of the $13.97 midpoint, d), which is the stricter treatment.
Source: AbbVie. Gaps and percentages are my arithmetic (d).
Forensic #4: Guidance And What Is Left Out
| 2026 adjusted EPS guidance | Low | High | Midpoint (d) |
|---|---|---|---|
| Prior | $13.76 | $13.96 | $13.86 |
| Current | $13.95 | $13.99 | $13.97 |
| Change | +$0.19 | +$0.03 | +$0.11 |
| Range width (d) | $0.20 | $0.04 | n/a |
| Year-to-date IPR&D impact included | $0.69 | $0.69 | n/a |
The guidance range narrowed from $0.20 to $0.04 wide (d), which is what a company does with one quarter to go, and the midpoint was raised by $0.11. The guidance includes the $0.69 per share of IPR&D incurred through September, and excludes any IPR&D that may be incurred after Q3, so any new licensing or acquisition in Q4 would reduce adjusted EPS below the range. That is a mechanical feature of the way AbbVie writes guidance and the release extract does not forecast any such charge. The Q3 charge was small ($0.11), but the year-to-date total ($0.69) is six times larger (d), showing how lumpy these items are.
Why it matters. A narrow range with an explicit exclusion tells investors where the uncertainty sits: business performance is expected to land within $0.04, while corporate development spending could move EPS by more than that in a single deal.
Source: AbbVie. Midpoints and widths are my arithmetic (d).
Valuation Snapshot
I did not retrieve AbbVie's share price, so no multiple is given. Against the guidance midpoint of $13.97 (d), an investor can compute the P/E directly from any quote: P/E = share price / 13.97.
| Measure | Figure |
|---|---|
| 2026 adjusted EPS guidance | $13.95 to $13.99 |
| Midpoint (d) | $13.97 |
| Q3 2026 adjusted EPS | $3.82 |
| Q3 adjusted operating margin | 48.7% |
| IPR&D impact, Q3 / year to date | $0.11 / $0.69 |
What has to be true. For the guidance to hold and for growth to continue, Skyrizi and Rinvoq must keep growing at 23% to 24% or close to it, the rest of the portfolio must at least hold at about 4% growth, and new IPR&D charges must be small enough not to move adjusted EPS much below the range.
Risks: What Would Break The Thesis
- Concentration. Skyrizi and Rinvoq are 48.7% of revenue (d).
- Deal charges. Guidance excludes IPR&D after Q3.
- Adjustment opacity. The $1.45 per share gap to GAAP is not itemised in my extract.
- Humira. It is down 31.2% and 3.9% of revenue; further erosion is a smaller drag each quarter.
- Sector read-through. FactSet's Pharmaceuticals -17% suggests other drug makers are not following AbbVie's pattern.
- Data limits. I did not retrieve exclusivity dates, pipeline or the segment detail of the 'other' products; prior-year product revenue is backed out from rounded growth rates.
The analysis could be wrong if the large GAAP-to-adjusted gap reflects costs that are recurring, in which case adjusted earnings overstate cash earnings.
What To Watch Next
- Skyrizi and Rinvoq growth against 22.7% and 23.9%.
- Humira's revenue against $683M.
- Fourth-quarter IPR&D charges, which fall outside guidance.
- Initial 2027 guidance and the treatment of IPR&D in it.
- GAAP versus adjusted EPS, once the adjustments are itemised.
- Other drug makers' reports, to see what drove the industry's -17% decline.

Sandeep Gupta
Independent equity research analyst publishing forensic theses on US-listed stocks. MBA, Politecnico di Milano School of Management (Milan, Italy).
Get new research in your inbox
Subscribe to receive forensic equity research the moment it's published. Free, no spam.
Related Research
Latest earnings releases: ABBV
— AbbVie Reports Third-Quarter 2026 Financial Results
Discussion
Be the first to comment.