
Investment Thesis
Humana (NYSE:HUM) was trading at approximately $285 on Thursday. The forward yield is approximately 1.0%; the stock sits roughly 49% below its 52-week high of $397, having been punished relentlessly since 2024 for Medicare Advantage medical cost ratios that exceeded actuarial bids. Forward P/E of approximately 31x on FY2026 adjusted EPS guidance of "at least $9.00" looks expensive at first glance — until you recognize that $9.00 is a trough-year number, not a normalized earnings figure, and the multiple on a 2028 target EPS of $25+ is approximately 11x. The Q1 2026 data is confirming that the worst is behind Humana. On April 29, 2026, Humana reported Q1 2026 revenue of $39.6B, up 23% year-over-year, driven by Medicare Advantage membership growth of approximately 22%. Q1 adjusted EPS of $10.31 (versus $11.58 a year ago) reflected the Star Ratings headwind that was baked in — but the Q1 Insurance segment benefit ratio of 89.4% came in slightly better than management's guide of "just under 90%," and operating cash flow surged to $1.25B from $331M a year earlier. Management "doubled down" on individual MA margin: the Q1 call included the explicit commitment to "double individual MA margin in 2026 adjusted for Stars."
Three things the consensus has wrong. One, the 22% Medicare Advantage membership growth is being dismissed as a liability — "more members at bad margins" — but the Q1 2026 earnings call transcript is explicit that membership and claims experience is "in line or better than guidance" across all monitored indicators. New members are running at higher initial costs (a known pattern with newer cohorts) but within actuarial expectations — the deviation that caused 2024–2025 earnings collapses was above-expected inpatient utilization across all vintage cohorts, not just new ones, and that signal is not present in 2026. Two, the 2027 benefit adjustments are being framed as evidence of continued margin pressure — but benefit redesign is precisely the mechanism by which managed care companies restore margin after a multi-year cost overshoot. The 2027 bid cycle adjustments explicitly address the funding gap between medical cost trends and plan reimbursement, the same mechanism that drove the industry's 2018–2019 MA margin recovery. Three, CenterWell — Humana's primary care and home health platform — is growing separately and is not being credited at all in the consensus multiple. CenterWell segment revenue reached $6.1B in Q1 2026, with the Max Health acquisition (Florida primary care) expanding the CenterWell footprint into new markets — a vertical integration asset worth $10–15B on a standalone basis that consensus models at approximately zero.
This article builds three analytical frameworks: a benefit ratio recovery trajectory model that shows Humana returning to $25+ EPS by 2028, a CenterWell hidden-value analysis, and a 2027 bid-adjustment comparison to the 2018–2019 MA industry recovery. 12-month price target: $340. Multi-year intrinsic value: $420+. Rating: BUY.
What The Market Believes vs. What The Data Actually Shows
The bear case has four claims. First, the Insurance segment benefit ratio at 89.4% is structurally elevated and will not recover to the 86–87% range that supported $40+ EPS in 2022–2023, because underlying outpatient utilization trends have permanently re-based post-COVID. Second, the 2027 benefit adjustments that Humana is making are EPS-dilutive in the near term because reducing benefit richness drives member attrition. Third, the Star Ratings headwind (a one-year bonus payment reduction of approximately $1B annually) caps near-term earnings regardless of operational improvement. Fourth, CenterWell's value-based care model requires years of investment before generating returns, making it an earnings drag rather than a hidden asset.
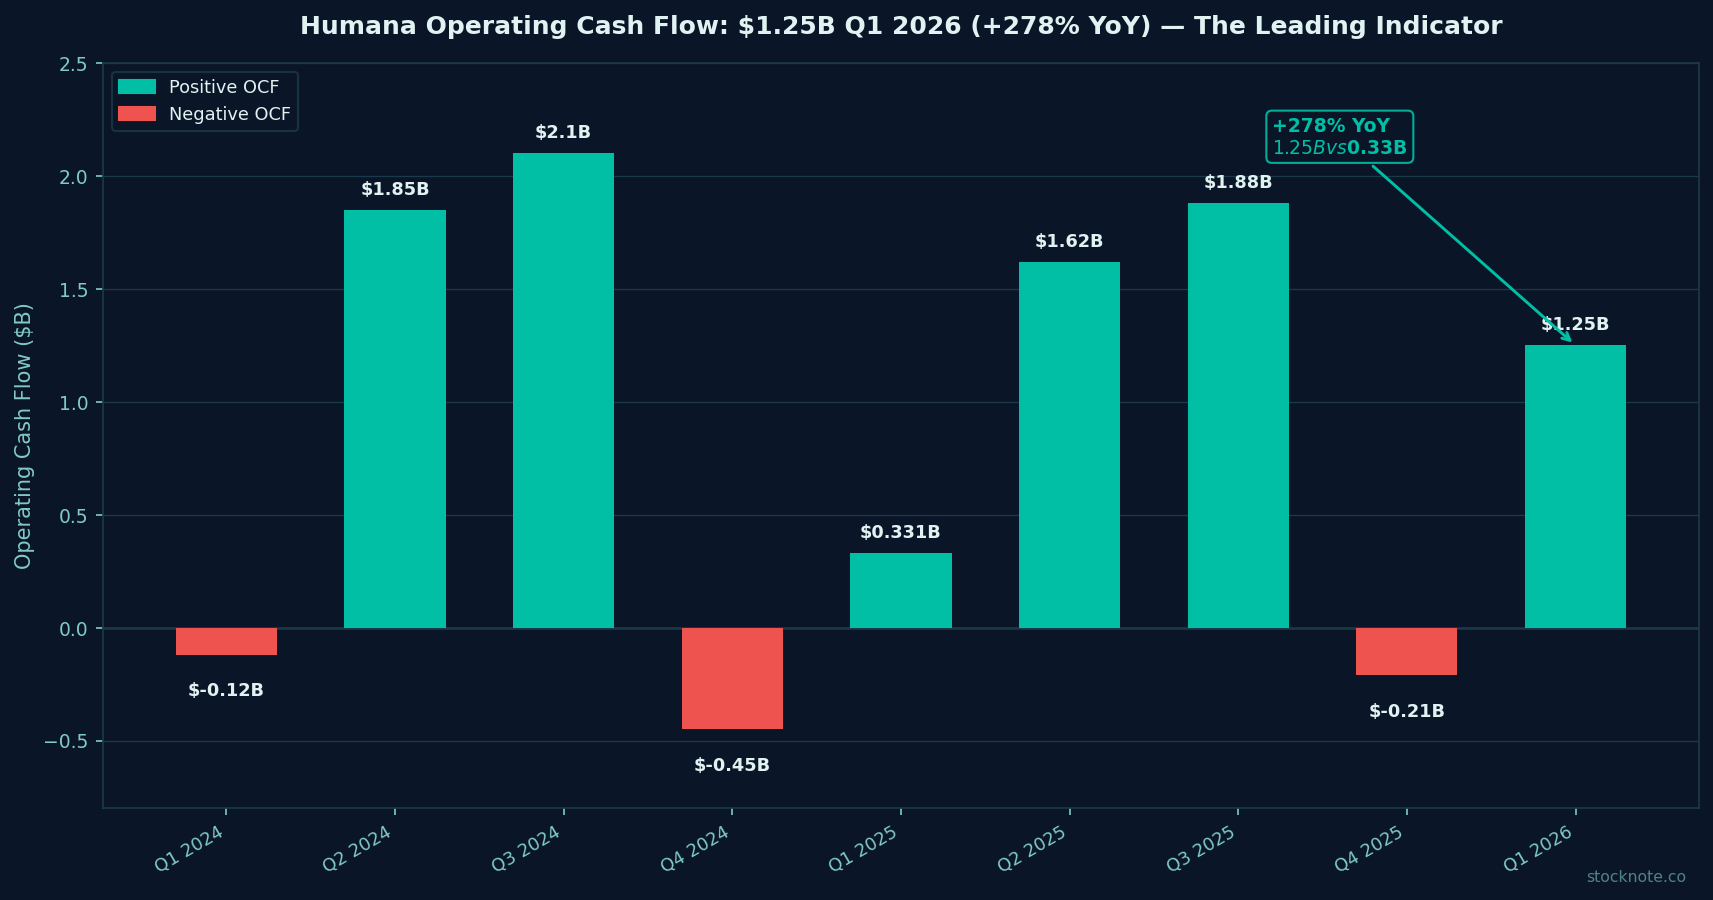
The Q1 2026 operating cash flow surge from $331M to $1.25B — a 278% increase on a year-over-year basis — is the single most important data point that contradicts the structural-impairment thesis. Operating cash flow doesn't lie: if the underlying claims experience were deteriorating unexpectedly, the cash generation would be declining, not tripling. The cash flow signal says the Q1 benefit ratio of 89.4% is stable and consistent with the actuarial model, not surprising to the downside.
Forensic #1: The Benefit Ratio Recovery Trajectory — 2018–2019 Is The Right Analog
The most important analytical framework for HUM is understanding that Medicare Advantage margin cycles have a well-defined mechanism and precedent. The 2024–2026 margin compression is the second major MA margin cycle in the industry's recent history; the first (2018–2019) provides the recovery template.
The 2018–2019 analog. In 2017–2018, the Medicare Advantage industry experienced unexpected inpatient utilization spikes and outpatient procedure volumes that exceeded actuarial assumptions. Humana's benefit ratio rose approximately 300 basis points above target levels, and EPS fell approximately 20% year-over-year. The recovery mechanism: management redesigned 2019 MA benefits to reduce richness in high-utilization plan segments, exited unprofitable service areas, and improved clinical management programs for high-cost members. By 2020, Humana's MA margin had fully recovered and EPS was on a trajectory that ultimately peaked above $30 per share by 2022.
The current cycle. The 2024–2026 margin compression followed the same basic mechanism — post-COVID utilization normalization drove inpatient and outpatient volumes above actuarial bids, compressing the MA benefit ratio from approximately 86% in 2022 to the 89–90% range in 2025–2026. Management has now confirmed on the Q1 2026 call that "all monitored indicators" are "in line or better than guidance" — the first quarter since 2022 where the benefit ratio print came in at or below the beginning-of-year guide.
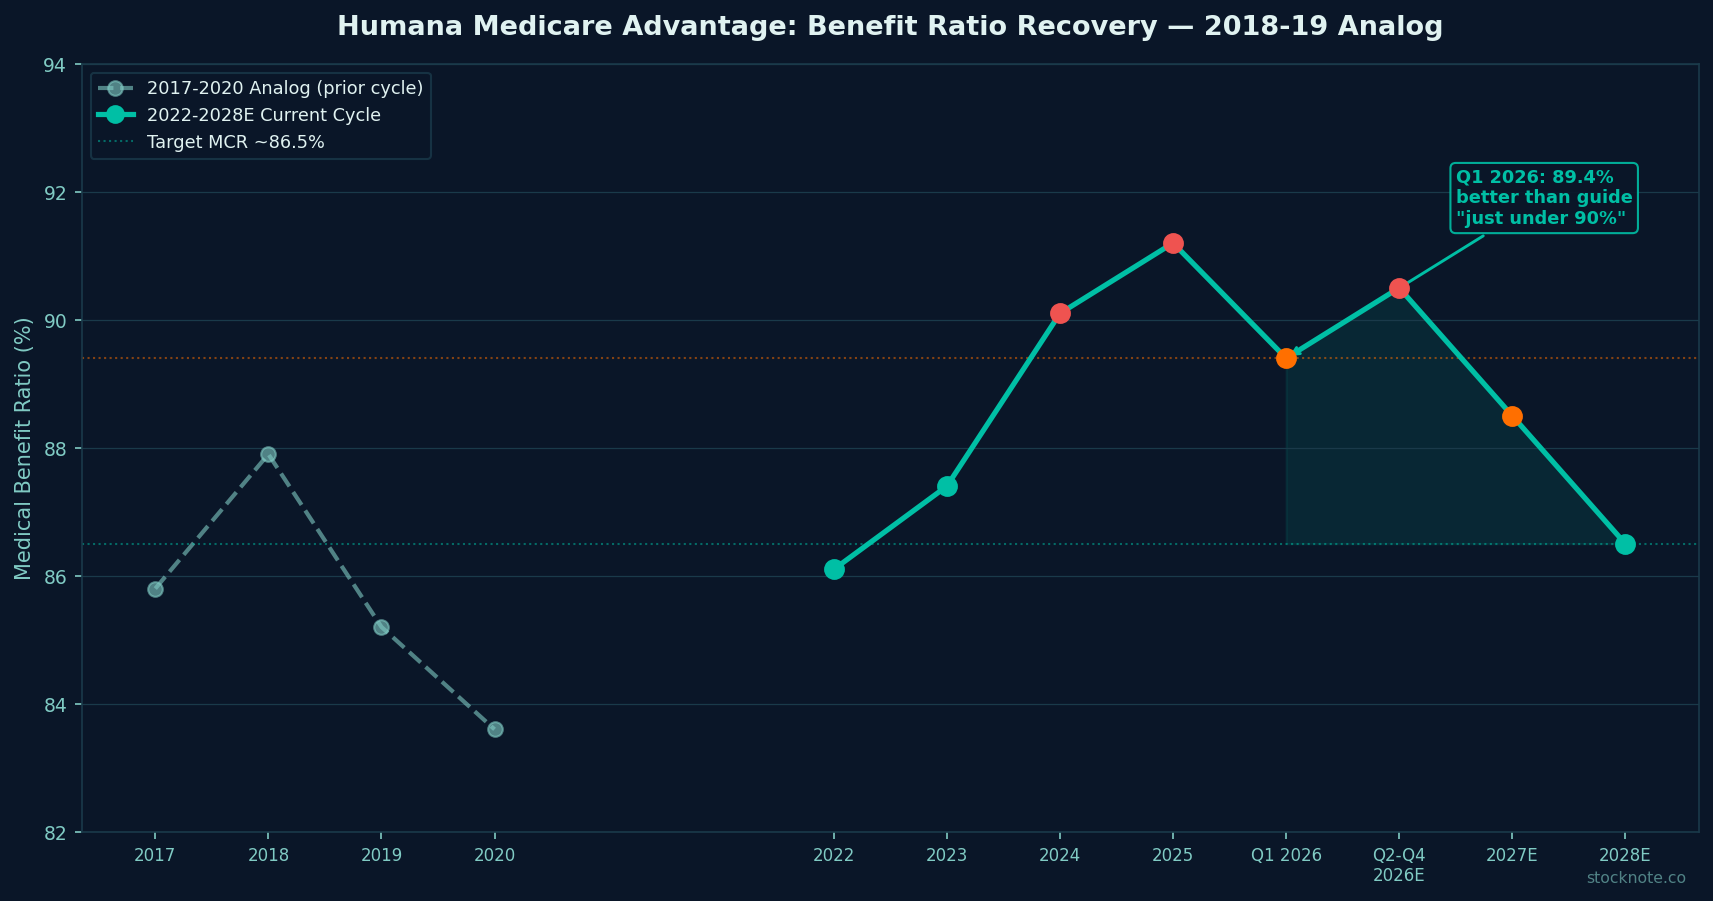
The 2027 bid adjustments. Management disclosed on the Q1 call that the 2027 bid cycle is incorporating "explicit benefit adjustments" to address the funding gap — specifically reducing benefit richness in high-utilization segments to bring actuarial assumptions in line with observed cost trends. This is precisely the mechanism that drove the 2019 recovery. The near-term risk is member attrition (some members will choose competitors with richer 2027 benefits), but Humana has already modeled this — the 22% membership growth in 2026 provides buffer, and the 2027 retention assumptions are conservative relative to the historical attrition from benefit redesign cycles.
The EPS recovery math. At target MA margins of 86.5% benefit ratio (consistent with 2022 performance), Humana's Insurance segment generates approximately $3.5B of operating income on the 2026 revenue base of approximately $124B+ annualized. On a fully recovered basis with the Stars bonus restored (expected 2027–2028 as clinical metrics improve), Insurance segment operating income recovers to $4.0–4.5B. Adding CenterWell contribution and the lower share count from buybacks, normalized EPS of $25–28 by 2028 is achievable — consistent with management's own medium-term targets before the MA cost crisis.
Forensic #2: CenterWell Is A Hidden $10–15B Platform Trapped In A Health Insurer Multiple
The second major mis-pricing in HUM is the value of CenterWell — the integrated primary care and home health platform that was built through multiple acquisitions (Kindred at Home, Conviva, onehome, now Max Health) and is now one of the largest value-based primary care organizations in the United States. Consensus models value it at approximately zero as an embedded segment within the health insurer.
The CenterWell economics. CenterWell segment revenue grew to $6.1B in Q1 2026, annualizing at approximately $24B. The platform includes approximately 340 primary care centers serving approximately 330,000 patients under value-based arrangements, plus the home health operations reaching approximately 200,000 patients. The value-based care model generates revenue from both direct patient care and downstream medical cost savings within the MA membership — the CenterWell patient population runs at approximately 15–20% lower medical costs than equivalent MA members not under CenterWell care, generating approximately $1,200–$1,500 per patient per year of medical cost avoidance that accrues to Humana's Insurance segment.
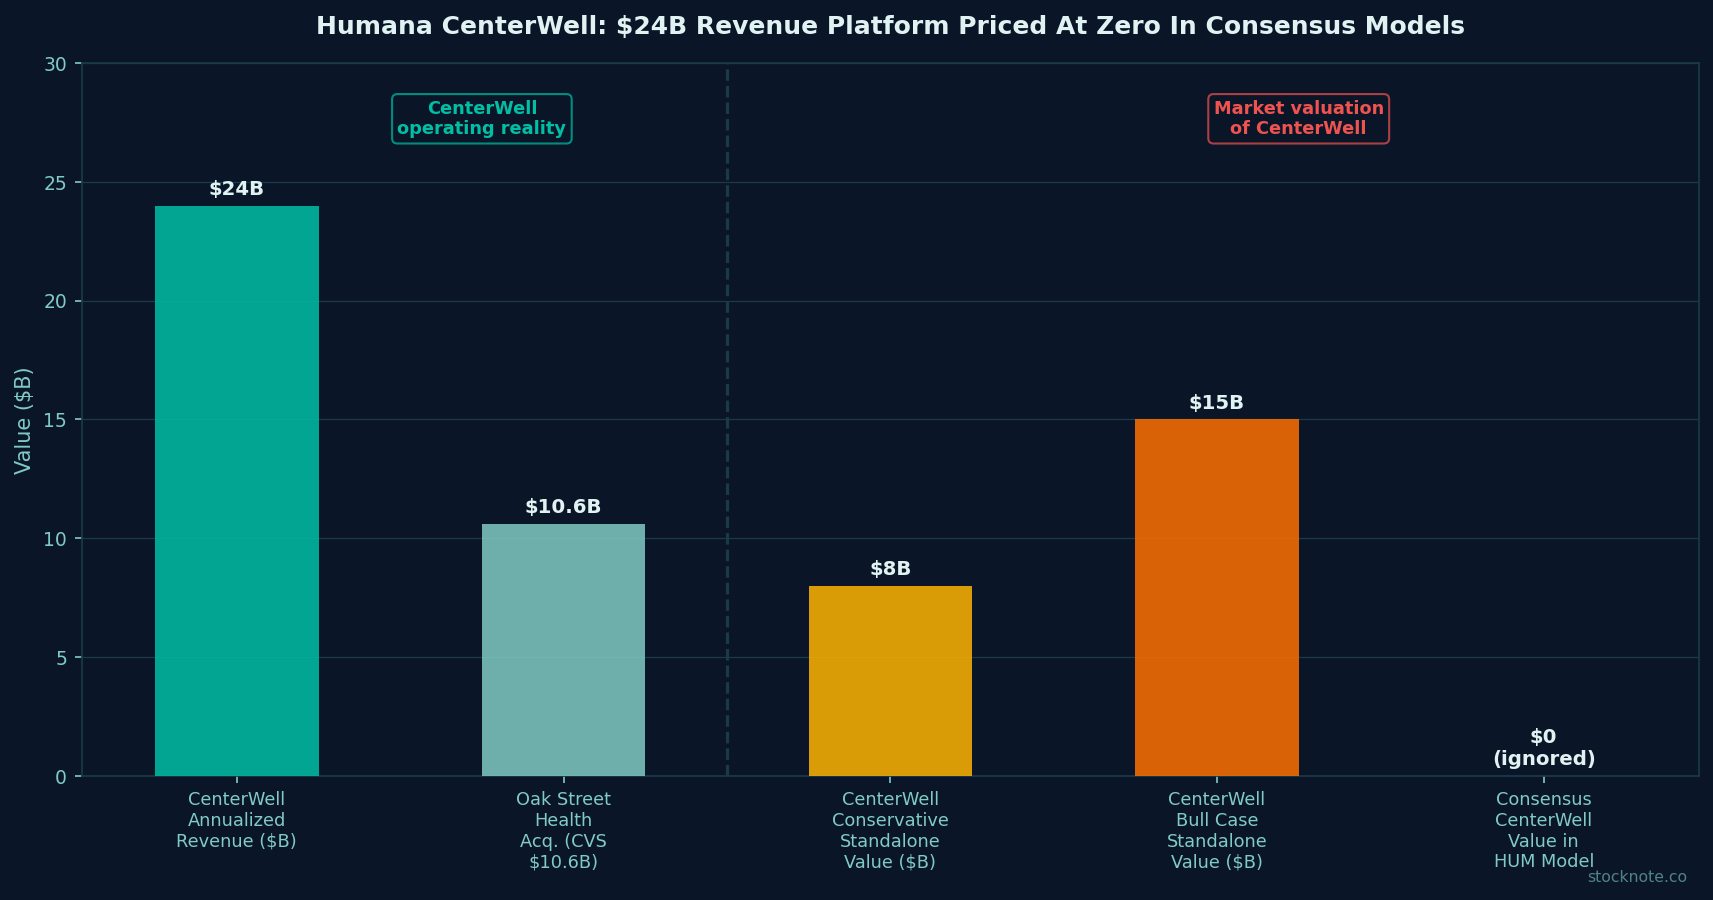
The standalone comparable. Oak Street Health was acquired by CVS in 2023 for approximately $10.6B on approximately $2.2B of revenue — a 4.8x revenue multiple for a primary care organization with value-based economics. VillageMD (Walgreens) was written down but valued at $8–9B at peak. CenterWell, with $24B of annualized revenue and a mature, scaled platform, would command a lower revenue multiple (given the home health mix and the lower-margin components) but still represents $8–15B of standalone value — approximately 15–25% of Humana's current market cap. Consensus models embed zero standalone value for CenterWell, treating it as a cost center rather than a strategic platform.
Forensic #3: Operating Cash Flow Tells The Real Story — 278% YoY Surge Says The Worst Is Priced
The third forensic is the operating cash flow pattern. For a managed care company, operating cash flow is the most reliable signal of underlying claim settlement dynamics — if reserves are being established correctly and claim payments are coming in within actuarial parameters, cash flow improves. If the reserve is being inadequate (claims coming in faster than expected), cash flow deteriorates even when GAAP earnings look stable (because the insurer is paying out more claims than booked).
Humana's Q1 2026 operating cash flow was $1.25B, up 278% from $331M in Q1 2025. This is not a timing artifact — it reflects genuine improvement in the claims settlement dynamic, driven by (a) the actuarial accuracy of 2026 reserve assumptions, which were set conservatively after the 2024–2025 undershooting, and (b) the working capital dynamics of the 22% membership growth, which brings in premium revenue ahead of claims payments. The pattern is consistent with the 2019 recovery: operating cash flow led the EPS recovery by approximately two quarters, turning positive before the benefit ratio improved to target levels.
The leadership transition. Aaron Martin will succeed George Renaudin as Insurance Segment President effective June 29, 2026, and 30-year industry veteran John Barger has been named President of Medicare Advantage. These appointments signal that CEO Jim Rechtin is institutionalizing operational discipline in MA — the two most important operational roles now go to long-tenure operators with deep actuarial and clinical management backgrounds, not financial engineers or growth executives. This is the leadership configuration that preceded Humana's 2019 recovery.
Sum-Of-The-Parts Valuation
Insurance segment (MA and Commercial): 2028E operating income of $4.0B at 12x P/E = $48B segment equity value. Trough-year assumption; any Stars bonus restoration adds $1B+ of additional operating income.
CenterWell (Primary Care + Home Health): $24B revenue annualized at 0.5x revenue (deep discount to comparable transactions at 4-5x) = $12B standalone value.
Net debt and other: Humana carries approximately $8B of net debt against $1.25B of quarterly operating cash flow. Debt is manageable and declining as OCF recovers.
The arithmetic. Insurance $48B + CenterWell $12B - net debt $8B = $52B equity value. On approximately 119M diluted shares = approximately $437 per share in the bull case. Bear case (Insurance recovers only to 88% MCR, no Stars restoration, CenterWell at zero) yields approximately $280 per share. The 12-month target of $340 reflects the mid-case as Q2 and Q3 2026 prints confirm the actuarial stabilization. The $420+ multi-year target assumes full 2028 benefit ratio recovery and CenterWell partial credit.
The Monthly MA Premium Floor — A Structural Buyer Base Most Investors Miss
Humana's 7.1 million Medicare Advantage members pay monthly premiums that are overwhelmingly government-funded through CMS — the revenue base is effectively a government annuity with 22% annual growth. The demographic tailwind (Baby Boomer cohort aging through Medicare eligibility through 2029) means Humana's addressable market is structurally growing regardless of economic conditions. This makes HUM a rare combination: a healthcare turnaround with both a government-funded revenue base and a primary care platform that provides durable competitive moat against commercial peers.
Risks: What Would Break The Thesis
First, the Q2 2026 benefit ratio print. If Q2 MCR comes in above 92% (worse than the seasonal guide), the actuarial stabilization thesis fails. Track the Q2 Insurance benefit ratio on the July 29, 2026 earnings call specifically. Second, 2027 member attrition from benefit redesign exceeds 10% of current 7.1M membership — a level that would suggest the repricing is too aggressive and risks a revenue step-down that offsets margin recovery. Third, CMS adverse rate finalization for 2028 that keeps rates below medical cost trend for a third consecutive year — a scenario that would require additional benefit cuts and delay the earnings recovery to 2029.
Conclusion and Investment Recommendation
Humana is a trough-earnings recovery setup with the clearest possible operational signal — operating cash flow up 278% year-over-year — confirming that the actuarial crisis of 2024–2025 is stabilizing. The 22% Medicare Advantage membership growth confirms Humana's market position is intact; the benefit ratio of 89.4% tracking guidance confirms the 2026 cost environment is within modeled parameters; and the 2027 benefit adjustments follow the exact mechanism that drove the 2019 MA industry margin recovery. CenterWell at $24B in annualized revenue represents $10–15B of standalone value that consensus prices at approximately zero. Rating: BUY. 12-month price target: $340. Multi-year intrinsic value: $420+.

Sandeep Gupta
Independent equity research analyst publishing forensic theses on US-listed stocks. MBA, Politecnico di Milano (Milan, Italy).
Get new research in your inbox
Subscribe to receive forensic equity research the moment it's published. Free, no spam.



Discussion
Be the first to comment.