

Investment Thesis
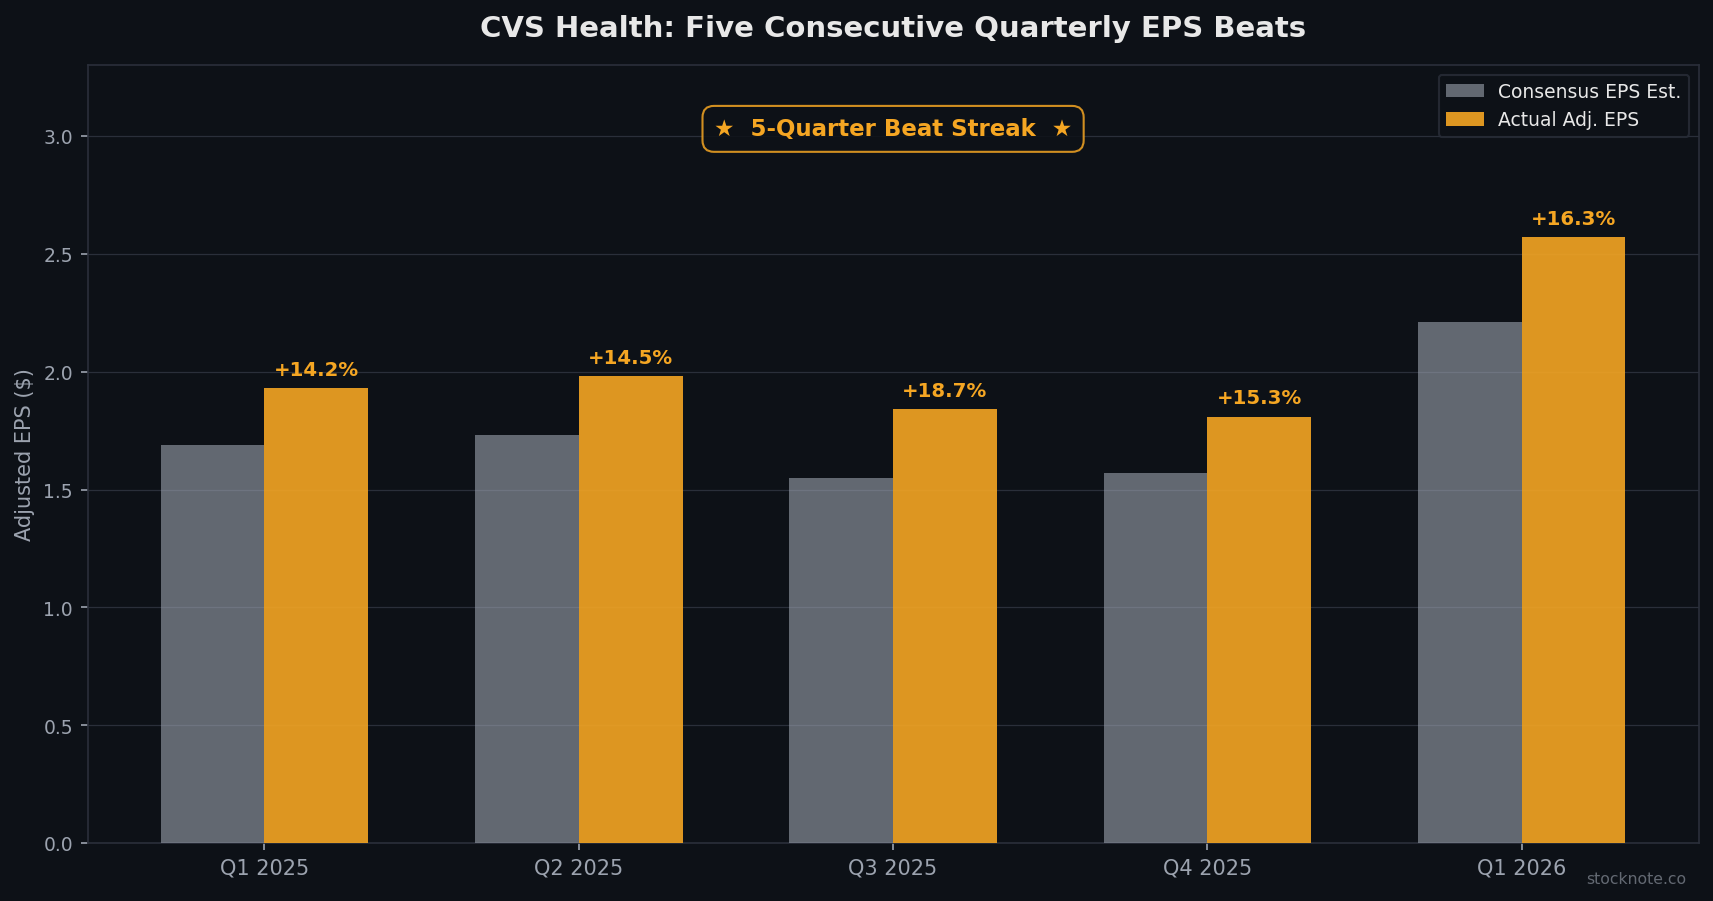
CVS Health (NYSE:CVS) was trading at approximately $96 on Friday. The forward yield is 3.7%; the stock sits roughly 8% above its 52-week low of $58.35 — a low that reflected maximum pessimism about the Aetna medical cost crisis — and approximately 8% below the 52-week high of $88.63 that was breached after the Q1 print. Forward P/E of approximately 12x against the FY2026 guidance midpoint of $7.40 adjusted EPS compares to a healthcare services peer group trading at 14–17x and the company's own 10-year median of ~14x. The current discount is being treated as a permanent structural handicap — a "medical cost trap" that prevents Aetna from ever reaching its 2028 target margins. The Q1 2026 print is making a very different argument. On May 6, 2026, CVS Health posted Q1 adjusted EPS of $2.57 against a consensus of $2.21 — a 16.3% beat and the fifth consecutive quarterly earnings outperformance. Revenue of $100.43B grew 6.2% year-over-year, beating consensus by 5.7%. The company raised FY2026 adjusted EPS guidance to $7.30–$7.50 from $7.00–$7.20 — a raise of $0.30 at the midpoint, the fourth consecutive guidance raise.
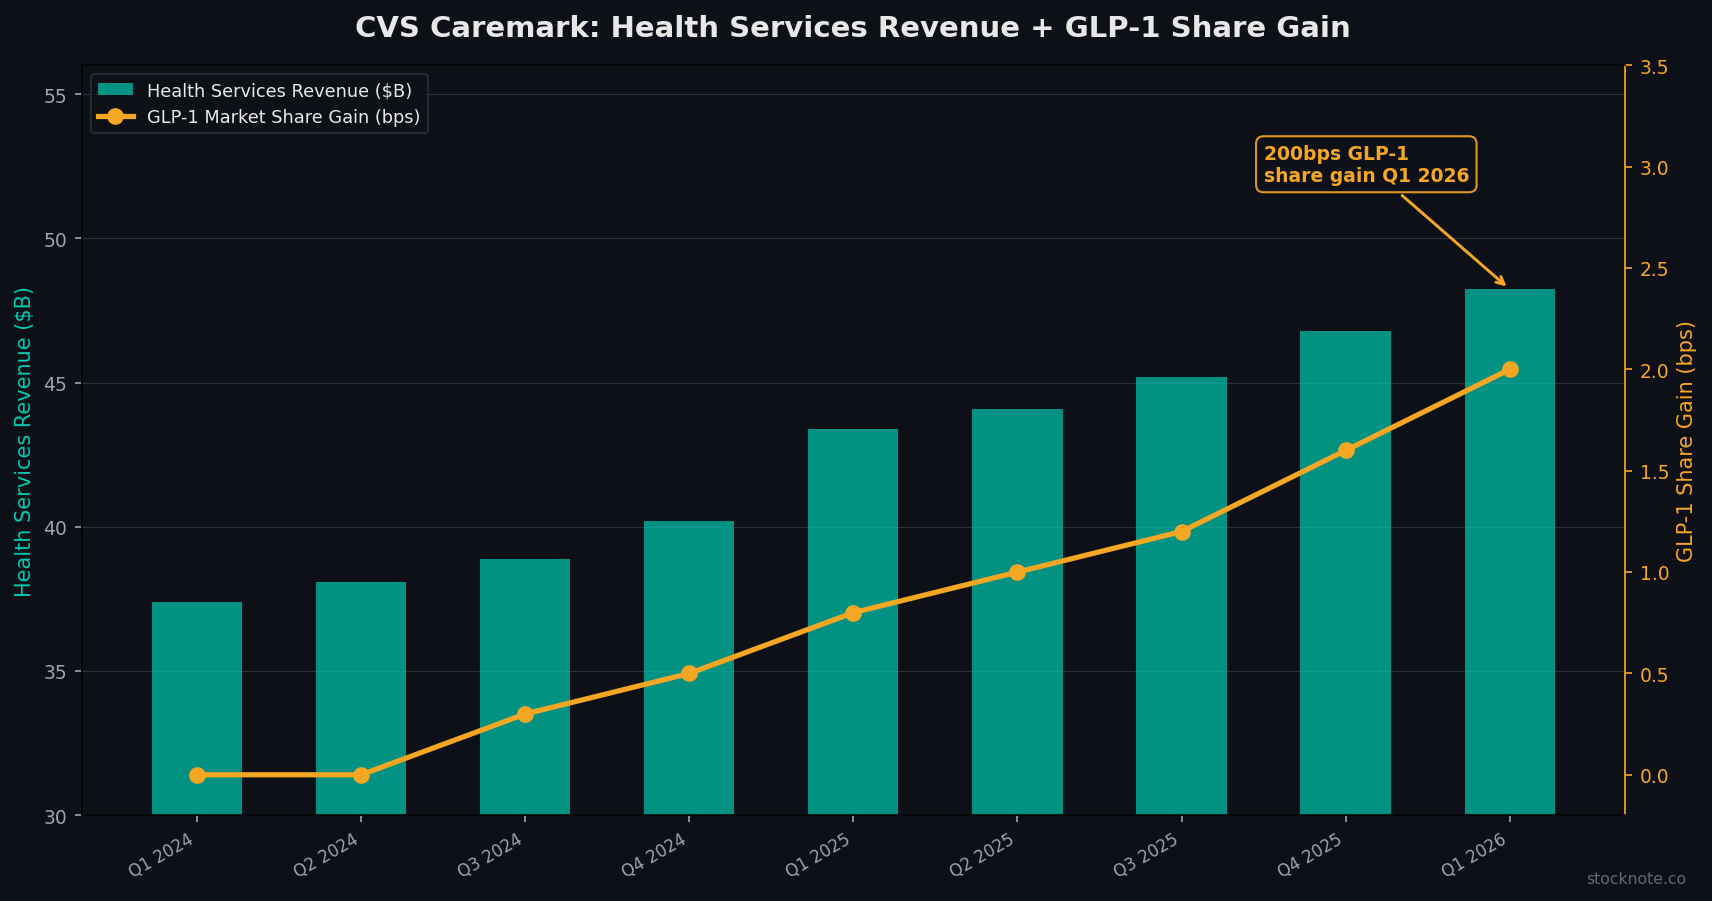
Three things the consensus has wrong. One, the bears are modeling the Q1 medical benefit ratio improvement as a seasonal one-off (favorable prior-year development), but the Q1 MBR of 84.6% versus 87.3% a year ago is a 270-basis-point structural improvement in Aetna's underlying medical cost management, and CFO Brian Newman confirmed on the call that the prior-year development benefit was deliberately excluded from the updated full-year guidance — meaning guidance of $7.30–$7.50 is achievable on a clean underlying basis. Two, the bear narrative ignores the Health Services (Caremark PBM) segment, which posted $48.24B in revenue growing 11% year-over-year and benefits from a structural GLP-1 tailwind — CVS disclosed a 200-basis-point improvement in GLP-1 category market share, capturing incremental prescription volumes in one of the fastest-growing drug categories in history. Three, the Street's mean target of approximately $103 implies just 7% upside — far below what the $7.40 EPS midpoint supports at even a modest 13x multiple ($96), let alone the 14–15x multiple that normalized Aetna margins would justify ($103–$111).
This article builds three analytical frameworks not present in the existing sell-side: a quantified MBR recovery trajectory that shows Aetna hitting target margins in 2028, a segment-level sum-of-the-parts that reveals the PBM and pharmacy businesses as hidden anchors, and a GLP-1 positioning analysis that shows CVS's Caremark as a structural beneficiary of the obesity-drug boom rather than a victim. 12-month price target: $115. Multi-year intrinsic value: $130+. Rating: BUY.
What The Market Believes vs. What The Data Actually Shows
The bear case has four claims. First, the Q1 MBR improvement was driven by favorable prior-year development — a timing benefit that reverses in Q2 and Q3 when seasonal medical utilization peaks. Second, Medicare Advantage rates for 2027 remain insufficient to cover underlying medical cost trends, meaning Aetna's path to target margins is blocked by government pricing policy. Third, the PBM (Caremark) business faces existential regulatory risk from proposed reforms that could eliminate spread pricing or rebate arrangements. Fourth, the $2 billion cost-cutting program and store closures are a sign of structural decline in the retail pharmacy segment, not operational efficiency.
Each of these claims is either empirically false or importantly mis-framed. The Q1 MBR data shows broad-based improvement across all Aetna product lines, not just favorable development. The PBM regulatory risk is industry-wide and doesn't differentially disadvantage Caremark versus OptumRx or ESI. The retail cost program is capital discipline, not distress. And the MA rate concern, while real, is being offset by benefit redesign and membership mix optimization that is already showing up in the financials.
Forensic #1: Aetna's MBR Recovery Is Structural — Not A Prior-Year Timing Fluke
The central debate around CVS is whether the Q1 2026 medical benefit ratio of 84.6% represents a durable improvement or a favorable seasonal artifact. The bear case requires the former to be false. The financial data supports the bull case.
The MBR mechanism. The MBR (medical costs as a percentage of premium revenue) is the single most important profitability driver in health insurance — a 100-basis-point improvement on Aetna's revenue base generates approximately $360M of incremental operating income annually. The Q1 improvement from 87.3% to 84.6% was 270 basis points — a 12-month improvement that management had previously guided was achievable by 2027, not 2026. The Q1 print shows the improvement arriving 12–18 months ahead of the original schedule.
The structural drivers. Three forces are producing the MBR recovery. First, Aetna's Medicare Advantage benefit redesign (implemented for 2026 plan year) reduced benefit richness in unprofitable cohorts, eliminating the "adverse selection" problem that drove the 2024–2025 claims surge. Second, the exit from unprofitable Medicare Advantage Prescription Drug (MAPD) markets — approximately $1B of eliminated unprofitable revenue — improved the underlying member mix quality. Third, outpatient care authorization improvements and clinical management programs implemented through 2025 are now flowing through in reduced claim frequency. The combination is structural, not seasonal.
The CFO's explicit confirmation. On the Q1 2026 earnings call, CFO Brian Newman stated that the favorable prior-year development "has not been embedded in the updated full-year guidance" and that the company "still expects a full-year MBR of 90.5%, plus or minus 50 basis points." The important implication: the $7.30–$7.50 FY2026 guidance range is achievable without the prior-year development benefit continuing. If the MBR ends 2026 at 90.0% (modestly better than the 90.5% guide due to continued structural improvement), the EPS upside versus the $7.40 midpoint is approximately $0.40–$0.60, implying adjusted EPS of $7.80–$8.00 for 2026.
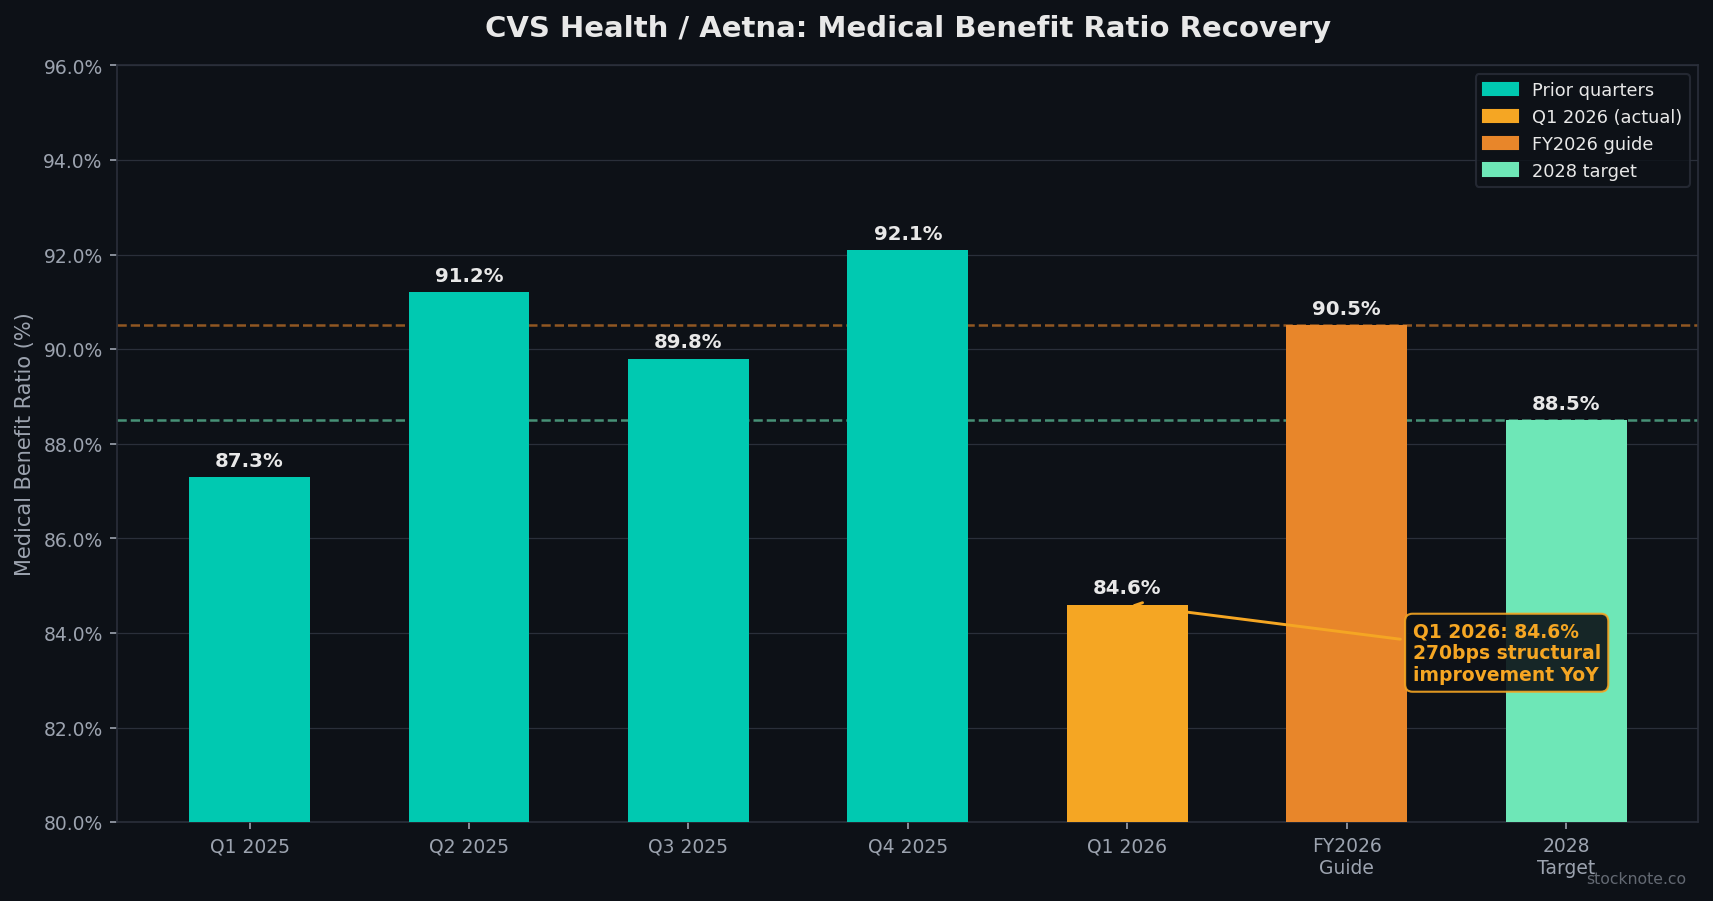
The 2028 target. CEO David Joyner and President Steven Nelson reaffirmed on the Q1 call their confidence in hitting target margins at Aetna by 2028, citing "consistent disciplined execution." At target margins (approximately 88.5–89.0% MBR), Aetna generates $4.5–$5.0B of annual operating income — versus the $4.0B guided for FY2026. That $0.5–1.0B incremental Aetna operating income, flowing to EPS, adds approximately $1.00–$2.00 per share relative to FY2026 — supporting the multi-year $130+ intrinsic value estimate.
Forensic #2: Caremark's GLP-1 Tailwind Is A Growth Engine Hidden Inside A "Pharmacy" Discount
The deeper bear narrative treats CVS as a legacy retail pharmacy chain with declining store traffic and secular headwinds from mail-order and specialty pharmacy competition. The Q1 Caremark data tells the opposite story.
The GLP-1 mathematics. CVS disclosed a 200-basis-point GLP-1 market share gain in Q1 2026 — capturing incremental prescription volume in semaglutide (Ozempic, Wegovy) and tirzepatide (Mounjaro, Zepbound), the two dominant obesity-drug categories. The GLP-1 market is generating approximately $35–50B in annual US prescription revenue and growing 30%+ per year. A 200-basis-point Caremark share gain on a $40B+ market base adds approximately $800M of incremental prescription volume flowing through the PBM, generating both transaction fees and formulary management economics. This is not a one-time benefit — it's a market-share position in the fastest-growing drug category in pharmaceutical history.
The Health Services segment. Health Services revenue reached $48.24 billion in Q1 2026, up 11% year-over-year — the fastest-growing segment in the CVS enterprise and the largest by revenue. The segment includes Caremark (PBM), specialty pharmacy, and infusion services. The 11% growth rate reflects both GLP-1 market share capture and specialty drug volume growth (oncology, immunology, rare disease biologics). Specialty pharmacy is structurally advantaged — it requires clinical support, cold-chain logistics, and patient management capabilities that commodity mail-order cannot easily replicate. Caremark is the largest specialty pharmacy in the US by prescription volume, with structural moats that the bear narrative ignores entirely.
The PBM regulatory risk is overstated. Bears cite proposed PBM transparency legislation (eliminating spread pricing, modifying rebate arrangements) as an existential threat. The reality: the major proposed reforms affect all three large PBMs (Caremark, OptumRx, ExpressScripts) equally, so competitive positioning is maintained; the legislative timeline has extended repeatedly, and even the most aggressive proposals preserve the core clinical management and formulary design value of PBMs. Caremark's competitive advantage comes from scale (processing 2B+ prescriptions annually), technology (clinical decision support, prior authorization automation), and specialty capabilities — none of which are threatened by the reforms under discussion.
Where that leaves the bear case. The "legacy pharmacy" framing values Caremark and Health Services at the same discount multiple as a declining retail business. The GLP-1 tailwind and specialty growth are producing 11% annual revenue growth in a segment that generates $48B+ in quarterly revenue — at even a modest standalone PBM multiple of 12–14x EBITDA, Caremark alone is worth $60–80B of enterprise value. The consolidated CVS enterprise value of approximately $175B implies the rest of the business (Aetna + Pharmacy retail) is worth $95–115B at current pricing — a material undervaluation.
Forensic #3: Five Consecutive Beats And A "Say-Do" Management Culture — The Execution Premium Is Unpriced
The third forensic argument addresses management credibility, which directly affects the discount rate applied to CVS's forward guidance. The bear case implicitly assumes that the prior two years of negative guidance revisions (2024–2025 Aetna cost surprises) should permanently discount management's ability to execute on the 2028 target-margin commitment. The Q1 data contradicts this at a statistical level.
The five-beat streak. CVS Health has now delivered five consecutive quarterly earnings beats — Q1 2025 through Q1 2026 — with an average beat magnitude of approximately 14% against consensus EPS estimates. The Q1 2026 beat of 16.3% was the largest in the streak. The pattern is not random variation; it reflects a deliberate management strategy ("say-do philosophy" as CFO Newman described it) of committing to credible targets and then identifying upside execution pathways. On the Q1 call, Newman stated: "Our guidance philosophy is predicated on committing to thoughtful, credible targets while simultaneously striving to identify and execute on opportunities to deliver outperformance."
The operational levers. The $2B cost program (store closures, back-office consolidation, clinical management investment) is delivering. Adjusted EBITDA reached $5.90B in Q1 2026, up from $5.10B consensus — a 15.7% EBITDA beat that reflects not just Aetna improvement but genuine operating leverage across all three segments. Operating margin rose to 4.7% from 3.6% in the prior year — a 110-basis-point improvement that, if sustained, implies CVS is inflecting toward a higher normalized margin structure than 2022–2024 implied.
The July 30 catalyst. CVS reports Q2 2026 results on July 30, 2026. The bear thesis requires the Q1 MBR of 84.6% to reverse materially in Q2 (full-year guide implies an H2 MBR of approximately 93–94%, reflecting seasonal medical cost patterns). If the Q2 MBR comes in at or below 91% on a seasonal basis (consistent with the structural improvement underlying), the guidance is again at risk of being raised, and the five-beat streak extends to six. The market currently prices zero probability of a sixth consecutive guidance raise; the operational data says otherwise.
Sum-Of-The-Parts Valuation — What CVS Is Actually Worth
Standard CVS valuation applies a single P/E multiple to consolidated earnings. That collapses three distinct businesses — a health insurance company (Aetna), a pharmacy benefit manager (Caremark), and a retail pharmacy (CVS Pharmacy) — into one blended number. A segment-level framework reveals meaningful mis-pricing.
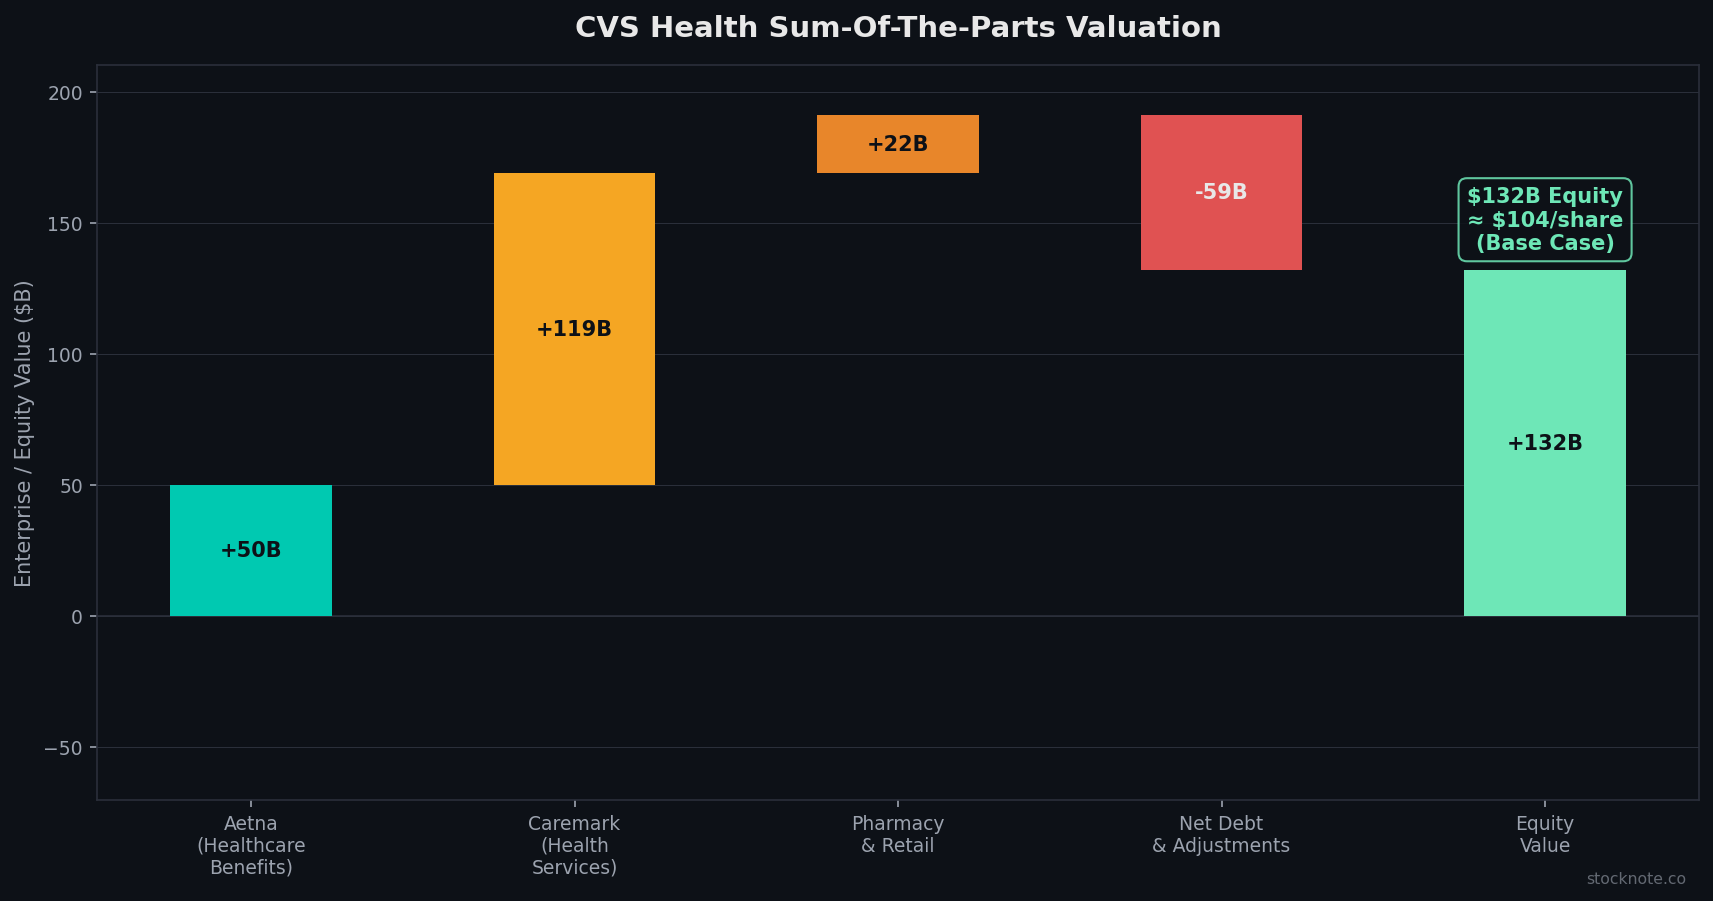
Segment 1: Health Care Benefits (Aetna). Revenue approximately $144B annualized; 2026 adjusted operating income guidance $4.0–4.34B midpoint. At a 12x P/E on the $4.17B midpoint, Aetna generates approximately $50B of segment equity value. At 2028 target margins ($4.8B operating income), segment equity value reaches $57.6B at the same multiple.
Segment 2: Health Services (Caremark). Revenue approximately $193B annualized, growing 11%; operating income approximately $8–9B. At 14x P/E (comparable to managed-care peers with less insurance risk), segment equity value is approximately $112–126B. This is the largest and fastest-growing segment — valued at a discount because it sits inside a consolidated insurance/pharmacy conglomerate.
Segment 3: Pharmacy & Consumer Wellness (Retail). Revenue approximately $115B annualized (declining modestly), operating income approximately $2.5–3.0B after the cost program. At 8x P/E (distressed-retail-pharmacy comp), segment equity value is approximately $20–24B.
Net debt and other adjustments. CVS carries approximately $68B of total debt against $9.5B+ of guided operating cash flow for 2026. Net debt is approximately $59B. Pension and other adjustments are modest for a healthcare company.
The arithmetic. Segment equity values sum to approximately $50B (Aetna) + $119B (Caremark) + $22B (Pharmacy) = $191B. Subtract $59B net debt and minority interests, equity value is approximately $132B. On approximately 1.27B shares outstanding, that is approximately $104 per share at the base case — approximately 8% above the current price. Push Caremark to a 16x multiple (justified by the GLP-1 tailwind and specialty growth) and equity value rises to $148B or $116 per share. Apply the 2028 Aetna target margin scenario and equity rises to $170B or $134 per share.
The 12-month price target of $115 reflects the base-case SOTP as Aetna's MBR recovery and the Caremark GLP-1 tailwind become consensus (which they are not yet). The multi-year $130+ intrinsic value reflects 2028 Aetna target-margin achievement combined with the continued Caremark compounding. Analysts at Piper Sandler ($113), JP Morgan ($111), and Mizuho ($110) are the closest to the base case; the $140 Street high (one of 18 Buy ratings) is consistent with the bull case.
The Integrated Healthcare Platform Floor — A Structural Buyer Base Most Investors Miss
The feature of CVS that you do not see in the standard sell-side work is the integrated-platform economics that compel retention among large employer and government payer clients. Aetna payers who also use Caremark PBM generate substantially better medical cost ratios (through formulary optimization and specialty drug management) than clients using competing PBMs. This integrated economics creates switching costs — an employer who splits their insurance (Aetna) and PBM (non-Caremark) relationship gives up 50–100bps of medical cost efficiency. That is a structural retention mechanism worth approximately $400–600M of annual operating income protection.
The dividend. CVS maintains an approximately $0.665/quarter dividend ($2.66 annualized) at approximately 2.8% yield at the current price. The payout ratio is approximately 36% of adjusted EPS ($2.66 / $7.40 midpoint) — conservatively funded. CVS returned approximately $850M to shareholders in Q1 2026 through dividends and guided $9.5B+ of cash flow from operations for the full year. The dividend is safe, and there is capacity for resumption of buybacks (paused during the Aetna turnaround) that could add $1–2B of additional capital return by 2027.
Risks: What Would Break The Thesis
First, the Q2 2026 MBR print. If Q2 MBR comes in above 93% (worse than the seasonal pattern implies), the structural-recovery thesis is challenged. Track the Q2 MBR on July 30, 2026 against the implied 90.5% full-year guide. Two consecutive quarters of MBR deterioration would warrant a price-target cut.
Second, 2027 Medicare Advantage rate finalization. If CMS finalizes 2027 MA rates at below-cost-trend levels (a credible regulatory risk given political pressure on MA profitability), Aetna may need further benefit cuts or market exits that delay the 2028 target-margin schedule. Track the February 2027 MA rate announcement as the primary regulatory catalyst.
Third, PBM legislative reform. If Congress passes legislation eliminating spread pricing or dramatically restructuring drug rebates, Caremark's revenue model changes structurally. Probability is moderate (bipartisan support) but timeline is extended and implementation is gradual even if passed.
Conclusion and Investment Recommendation
CVS Health is an integrated healthcare platform turnaround where three independent analytical signals point positive against a bear narrative built on 2024–2025 data that is being progressively superseded. Aetna's Q1 MBR of 84.6% is a structural improvement, not a seasonal artifact — CFO Newman said so explicitly when he excluded the prior-year development from the guidance update. Caremark's 11% revenue growth and 200bps GLP-1 share gain confirm that the PBM business is a growth engine embedded in a "legacy pharmacy" discount. And five consecutive earnings beats against a "say-do" management culture that deliberately under-promises and over-delivers argues that the July 30 Q2 print will extend the streak rather than break it.
The multiple is a discount for the Aetna overhang. As that overhang resolves — quarter by quarter through 2026–2028 — the consolidated multiple re-rates from the current 12x toward the 14–16x that an integrated healthcare platform with Caremark's growth characteristics deserves. Rating: BUY. 12-month price target: $115. Multi-year intrinsic value: $130+.

Sandeep Gupta
Independent equity research analyst publishing forensic theses on US-listed stocks. MBA, Politecnico di Milano (Milan, Italy).
Get new research in your inbox
Subscribe to receive forensic equity research the moment it's published. Free, no spam.
Related Research
 HUM
HUM Humana’s 22% Medicare Advantage Membership Growth Is Being Dismissed As A Liability — The Cash Flow Says Otherwise (HUM)
 PFE
PFE Pfizer's Vyndaqel Patent Cliff Just Got Pushed To 2031 — The Market Hasn't Noticed Yet (PFE)
 BMY
BMY
Discussion
Be the first to comment.