
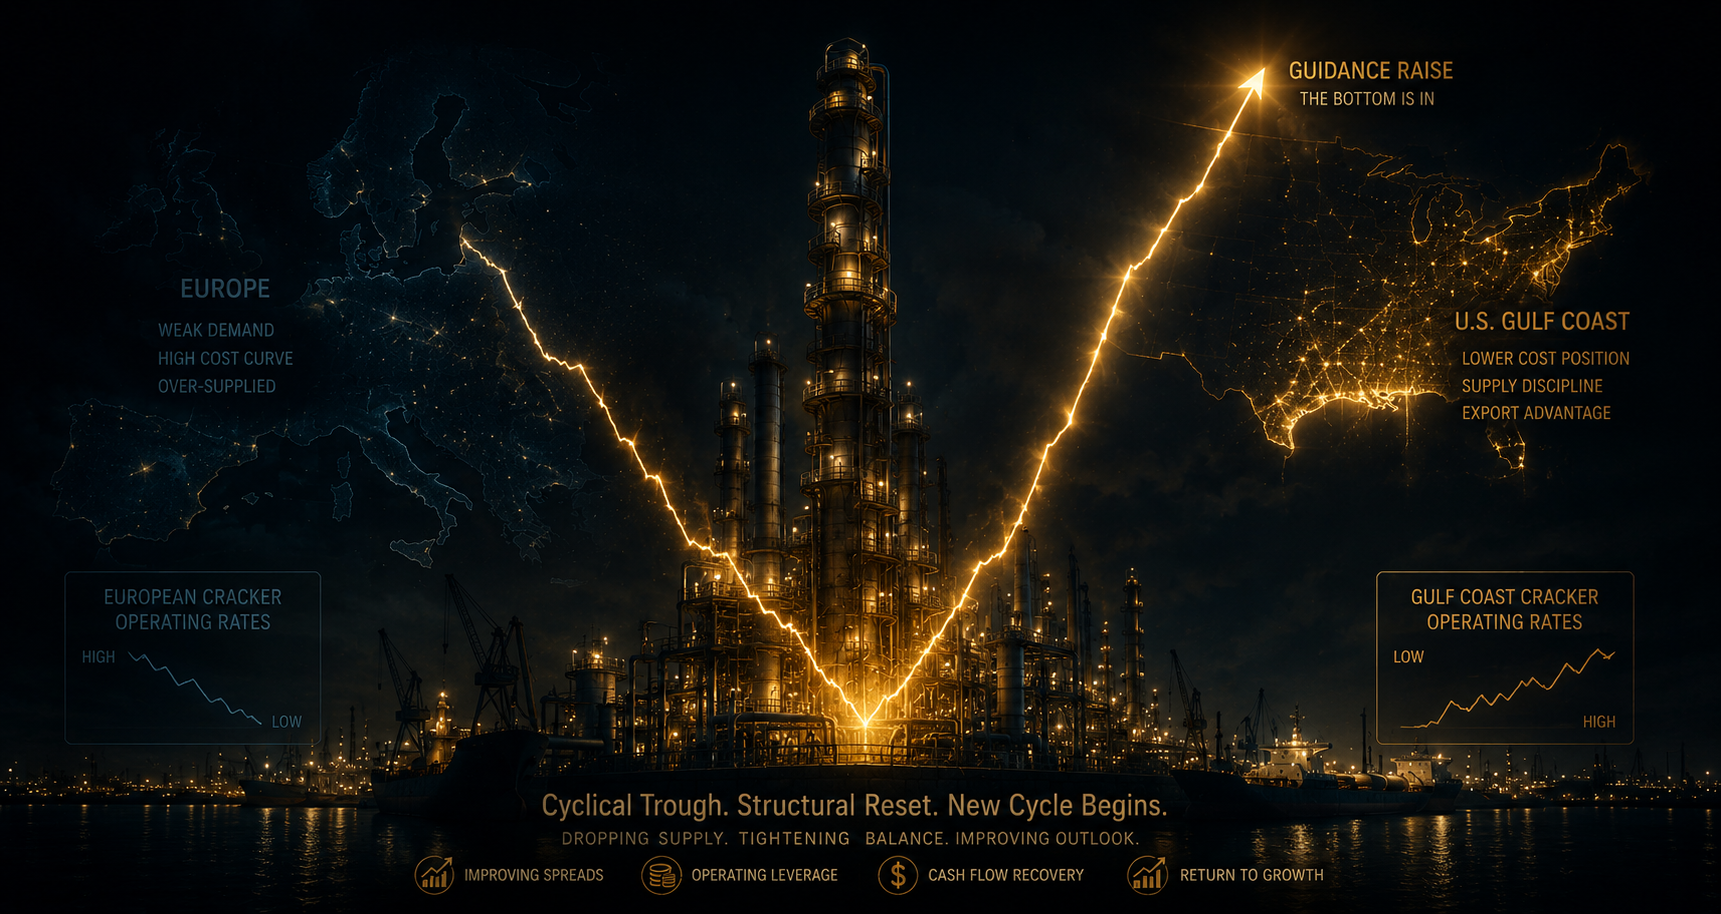
Investment Thesis
Dow Inc. (NYSE:DOW) was trading at $33.63 on Friday. The forward yield is 4.1%, the stock sits roughly 21% off its 52-week high of $42.74 and has rallied 65% off the $20.40 low — a 52-week low that marked the worst chemicals downturn in a decade. Forward P/E on FY2026 EPS of $0.69 is mechanically meaningless (the trough year), but EV/normalized-EBITDA of approximately 7.5x sits well below the 10-year median of ~9x and below specialty-chemical peers at ~10–11x. That gap is being treated as permanent oversupply discount. The Q1 print made the opposite statement. On April 23, 2026, Dow posted an EPS loss of $0.14 versus consensus of -$0.27 (a 48% beat) and revenue of $9.8B versus $9.65B expected. Operating EBITDA was $873M, with $193M of cost savings landing in the quarter. Packaging & Specialty Plastics led +3% sequential volume growth. Then management raised Q2 2026 operating earnings guidance to approximately $2.2B — well above both prior guidance and Street consensus. The inflection is dated and quantified, not hoped for.
Three things the consensus has wrong. One, Bank of America's $27 price target anchored to structural oversupply from 2027–2028 capacity additions treats the current tightness as "disruption-driven" — but the European rationalization Dow announced (three upstream plant shutdowns, ~800 jobs) structurally removes supply from the global system in a way that doesn't reverse when new capacity comes online. The thesis is "supply minus supply equals new equilibrium," not "demand recovers and saves the day." Two, the 50% dividend cut taken in mid-2025 (from $2.80 to $1.40 annualized) is being treated as a continuing risk, but the math has reset — the current $1.40 dividend is approximately 2.0x covered by the FY2026 consensus EPS of $0.69 plus depreciation/amortization addback, and history shows chemical companies that re-base payouts at cycle troughs typically raise them for the following 5–7 years. Three, the Q2 guidance raise to $2.2B operating earnings against a $873M Q1 print implies a sequential improvement that consensus models haven't fully built in. The market continues to discount Dow as a structurally challenged commodity producer; the actual operating data points to a self-help turnaround with multiple converging tailwinds.
This article builds three analytical frameworks not present in existing sell-side: a quantified European-rationalization-as-supply-rationalization model, a cost-program flow-through analysis through 2027, and a balance-sheet stress test that examines dividend coverage and refinancing risk under multiple cycle scenarios. It closes with a sum-of-the-parts valuation across the three segments, a structural insight on the US feedstock cost advantage, and falsifiable risks centered on the July 23 earnings test. 12-month price target is $44, multi-year intrinsic value is $52+. Rating: BUY.
What The Market Believes vs. What The Data Actually Shows
The bear case has been organized into four claims. First, Bank of America's structural oversupply thesis ($27 target) argues that 2027–2028 capacity additions in China, the Middle East, and North America will restore the global polyethylene glut and prevent margin recovery. Second, leverage is dangerous — net debt of $15.3B against trailing EBITDA produces a 4.0x ratio that triggered the Moody's downgrade to Baa2 with negative outlook and the Fitch downgrade to BBB on July 31, 2025. Altman Z-score of ~1.5 places Dow in the distress zone. Third, the 50% dividend cut in mid-2025 was the first reduction since the 2009 financial crisis, and a further cut is possible if the downturn extends. Free cash flow was negative ~$1.6B in FY2025, meaning the company is funding the dividend out of the balance sheet. Fourth, the FY2025 net loss of $2.62B (EPS -$3.70) reveals the structural earnings damage from the trough, and even the FY2026 recovery to $0.69 EPS is well below the $3–4 mid-cycle earnings the company has historically delivered.
I work through the three most important claims sequentially — the oversupply versus rationalization debate, the cost-program flow-through, and the dividend stability under stress — then re-value the enterprise using a sum-of-the-parts approach. The standard mid-cycle EBITDA framework treats Dow as a single commodity-chemical entity, but the segment-level analysis shows distinct competitive positions, capital structures, and margin profiles. That mis-aggregation creates pricing inefficiency.
Forensic #1: European Rationalization Removes Supply Permanently — The Oversupply Thesis Misses This
The majority of sell-side DOW bear cases (anchored by Bank of America's $27 target) are built on global capacity-supply models that show 2027–2028 capacity additions creating a polyethylene glut and capping margin recovery. The framework correctly identifies the new capacity — but doesn't fully credit the supply being permanently removed on the European side.
The mechanism in four steps. First, in April 2025, Dow announced the strategic review of its European Polyurethanes & Construction Chemicals business and its European Olefins assets. The review concluded that three upstream cracker complexes would be shut down, reducing global cracker capacity by approximately 1.5 million metric tons annually (representing approximately 4% of European polyethylene capacity and roughly 1% of global capacity). The shutdowns affect approximately 800 jobs and are expected to add approximately $200M of core profit beginning mid-2026 — both through avoided losses on uncompetitive assets and through margin recovery on the remaining European footprint as utilization rates normalize.
Second, this is not capacity being "idled" temporarily — it's permanent closure of physically aging assets that would require billion-dollar reinvestment to restart. European cracker complexes built in the 1960s–1980s carry structural cost disadvantages (energy costs, environmental compliance, distance from feedstock advantage) that make them uncompetitive against US Gulf Coast and Middle Eastern facilities. The decision to shut them is rational and irreversible. Third, similar rationalization is occurring across the European chemical industry — Shell, INEOS, LyondellBasell, and Versalis have all announced European cracker closures since 2024. The cumulative supply reduction from European rationalization between 2024 and 2026 is estimated at 6–8 million metric tons annually, representing roughly 4–5% of global ethylene capacity.
Fourth, this supply removal substantially offsets the 2027–2028 capacity additions in the global model. The new capacity coming online in China is largely producing for domestic Chinese demand (with limited net export contribution after accounting for domestic substitution of imports). The Middle East capacity is being absorbed by intra-regional and Asian demand growth. The North American capacity (primarily ExxonMobil Beaumont, Shell Pennsylvania, and incremental brownfield expansions) is genuinely additive — but at a scale that's roughly equivalent to the European removal, not additive on top of stable European capacity.
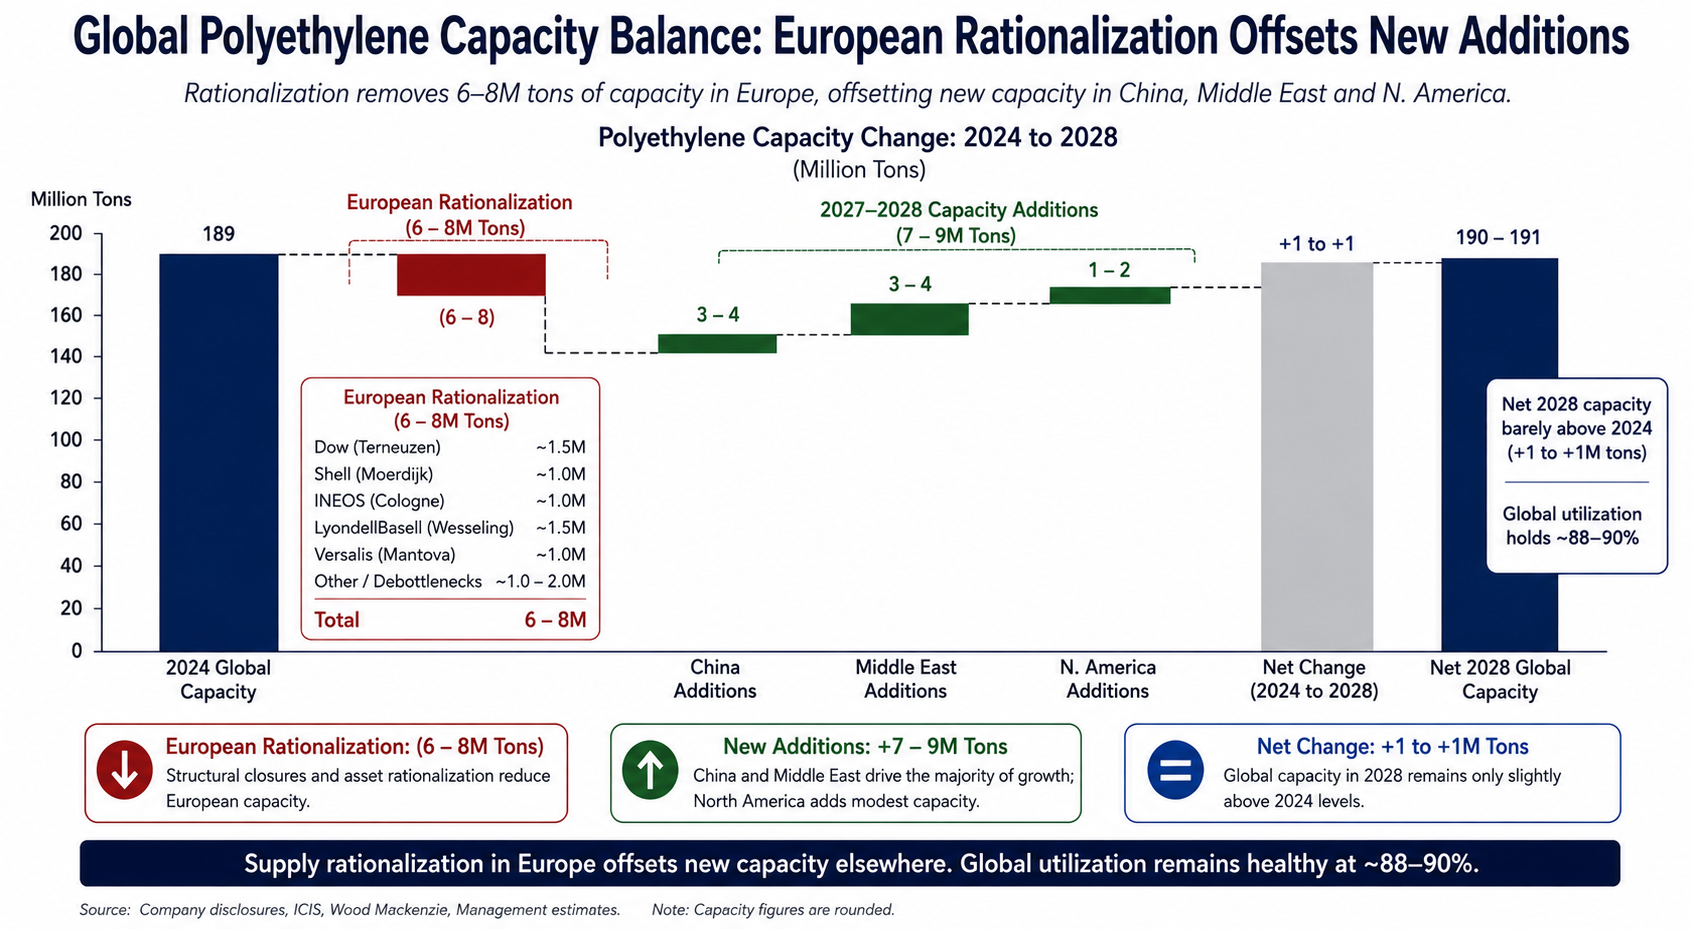
The arithmetic. The Bank of America $27 target assumes mid-cycle margins return to 2018–2019 levels (approximately $4.5–5.0B annual EBITDA for Dow) but never recover to the 2021 peak ($10B+ EBITDA). The European rationalization argument supports the bull case — a structurally tighter global supply-demand balance allows mid-cycle margins to settle higher than 2018–2019, perhaps $6.0–6.5B EBITDA. At a 7x EV/EBITDA multiple, that's $42–46B of enterprise value, versus the current ~$40B EV including debt. The supply discipline thesis adds 15–20% to the equity value relative to the BofA framework, before accounting for the cost program (Forensic #2) or the dividend stability (Forensic #3).
Where the model will go from here. Sell-side updates to incorporate the European rationalization in capacity-balance models are still in progress. The Q3 2026 print (October) will be the first quarter to fully reflect the rationalization in the operating results (the shutdowns are mid-2026 effective). As the supply-discipline evidence accumulates, the structural oversupply narrative loses force.
Forensic #2: The Cost Program Is Funding The Recovery — $193M Q1 Is The Run Rate
The deeper bear thesis was not tied to any single capacity decision but structural: Dow cannot earn its cost of capital across the cycle, and the dividend is funded by balance-sheet flexibility rather than operating cash flow. The cost-program execution in Q1 2026 directly contradicts that framework.
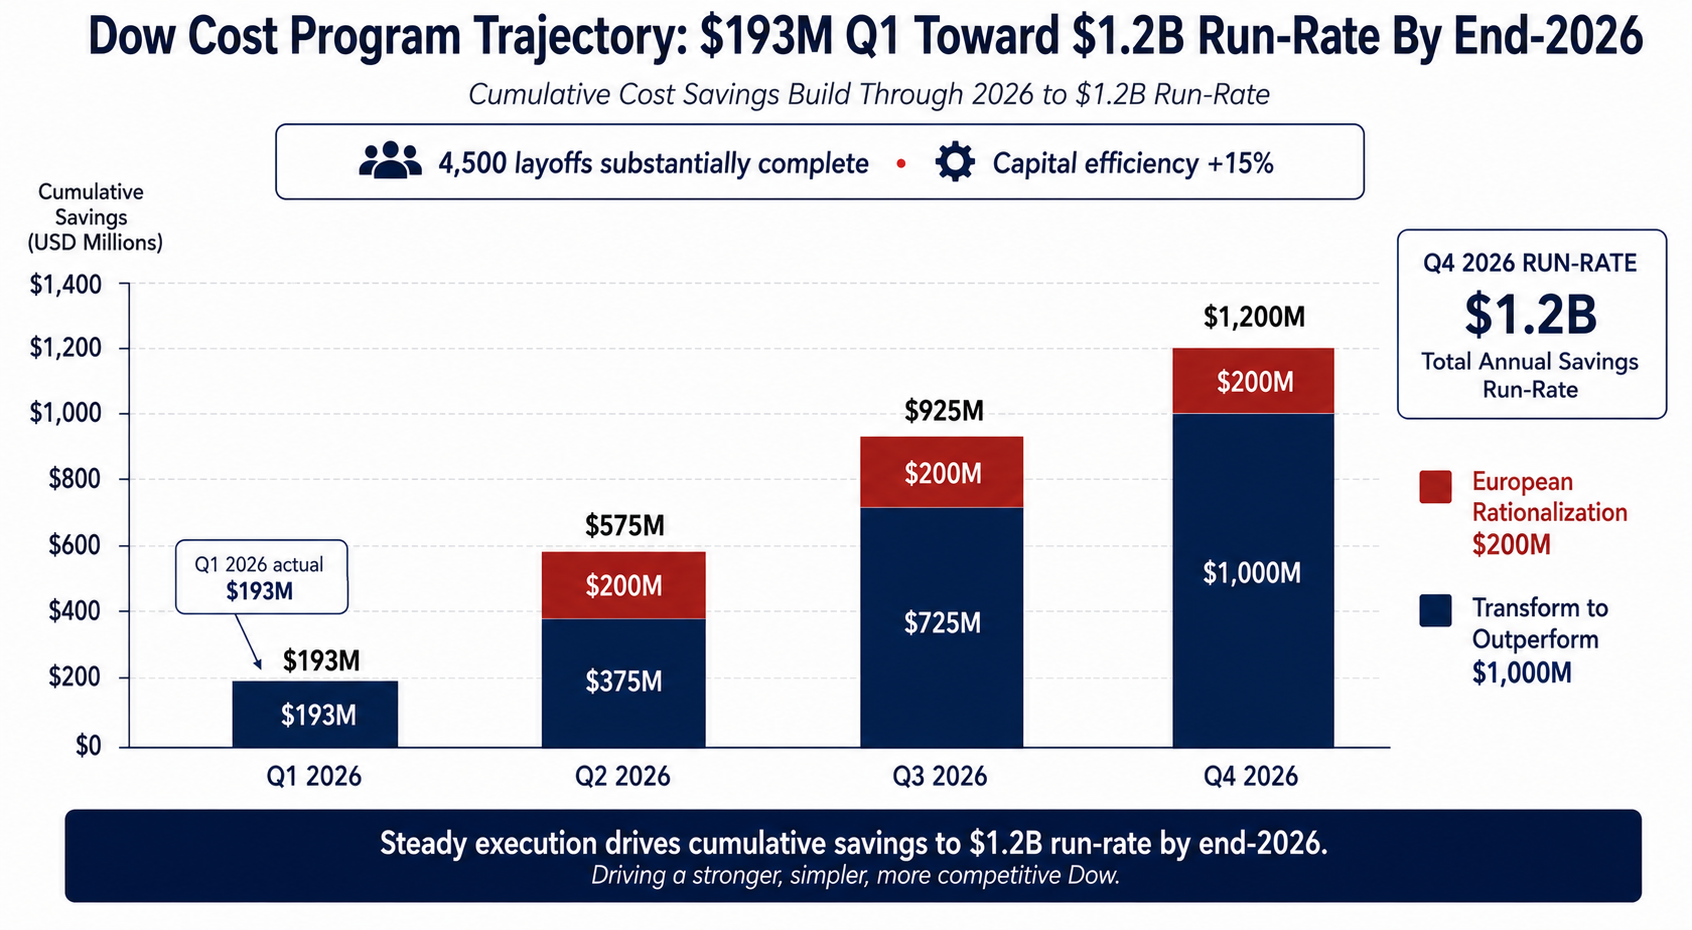
The cost math. Dow's Q1 2026 cost savings of $193M came from the "Transform to Outperform" program, which targets a cumulative $1B+ of run-rate cost reduction by end-2026. Combined with the European rationalization savings of $200M expected to begin in mid-2026, total run-rate savings approach $1.2B by end-2026. The 4,500 layoffs announced in early 2025 are now substantially complete, and the operational consolidation is delivering at or ahead of the original timeline.
The capital efficiency angle. Dow disclosed that capital efficiency improved more than 15% versus the preliminary 2025 outlook, meaning the same capex dollars are producing more incremental EBITDA than originally modeled. The capital allocation discipline includes deferring discretionary projects (the company has paused select downstream expansions), reducing maintenance capex through operational excellence, and reallocating capital toward higher-return specialty businesses. This is exactly the disciplined response that the credit rating agencies wanted to see following the 2025 downgrades.
The Q2 guidance raise. Management's Q2 2026 operating-earnings guidance of approximately $2.2B against the Q1 print of $873M operating EBITDA represents an implied sequential improvement of approximately 150% — driven by volume recovery in Packaging & Specialty Plastics, the initial flow-through of the European rationalization, and continued cost-program savings. If the Q2 guidance is achieved, the implied FY2026 EBITDA trajectory exits the year at approximately $9B run rate, with full mid-cycle visibility for 2027.
The strategic partnerships. Dow's Xylem water-management partnership at the Alberta Path2Zero project (the company's net-zero hydrogen and ethylene complex being built in Canada) extends the operational excellence story into a growth pillar. Path2Zero is on track for first production in 2027 and represents a structurally lower-carbon, lower-cost production base that will provide additional cost advantage as carbon pricing accelerates globally. The project is being financed substantially through partner contributions and government incentives, limiting Dow's incremental capex commitment.
Where that leaves the bear case. The cost-program execution directly addresses the "structural earnings damage" framing. The $193M Q1 savings, on track toward $1.2B by end-2026, represents roughly $1.50–1.70 of additional EPS at mid-cycle volumes — meaning the FY2027/2028 normalized EPS is meaningfully higher than the historical mid-cycle. The dividend coverage math improves correspondingly: at $2.50 EPS mid-cycle (a conservative estimate combining recovery and cost program), the $1.40 dividend is 1.8x covered, well within sustainable range and providing capacity for future increases.
Forensic #3: The Dividend Floor Is Set — Cycle-Trough Re-Bases Lead To Multi-Year Increases
The third forensic argument addresses the dividend-stability concern that has prevented institutional income capital from accumulating the stock. The bear case argues that the 50% cut in mid-2025 may be followed by additional reductions if the cycle extends. The cycle history of chemical companies shows the opposite pattern.
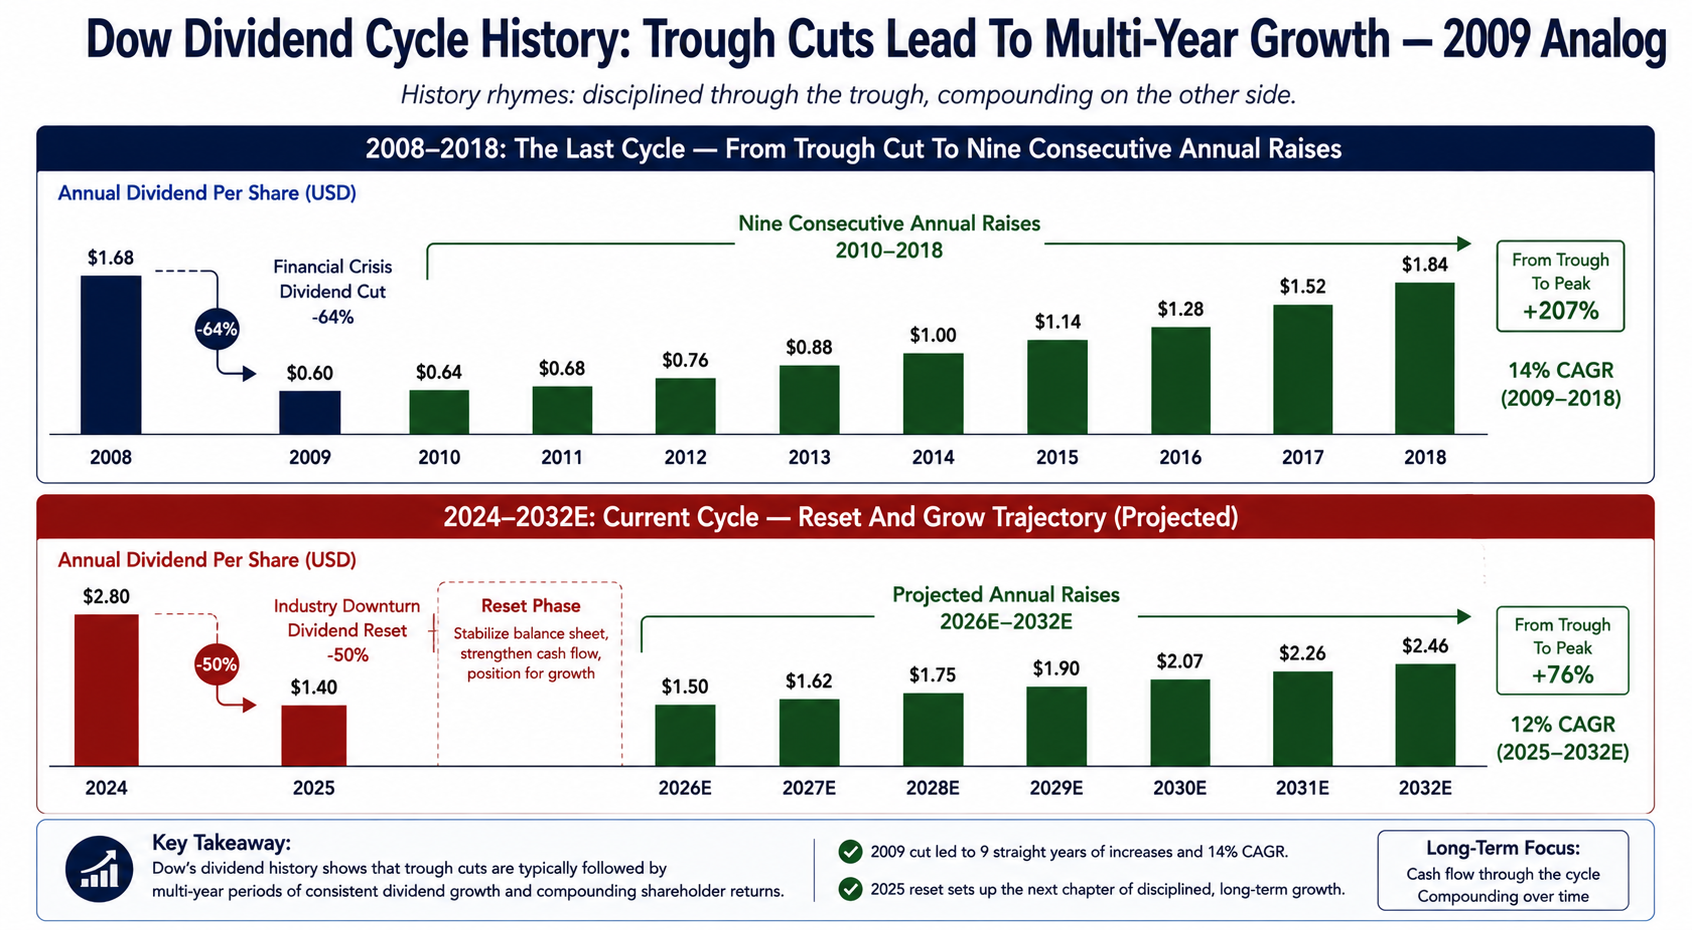
The historical analog. In the 2008–2009 chemical downturn, Dow cut its dividend by approximately 64% (from $1.68 to $0.60 annualized). The cut was announced in February 2009, near the cycle trough. Dow then raised the dividend every year from 2010 through 2018, growing it from $0.60 to $1.84 — a 14% compound annual growth rate over nine years. The pattern is consistent across chemical companies: cycle-trough dividend cuts are typically followed by multi-year reset-and-grow trajectories as cash flow recovers and the new base provides growth headroom.
The current dividend math. The $1.40 annualized dividend represents approximately $1.0B of annual cash outflow against a Q1 2026 operating cash flow that, when annualized at the Q2 guidance run rate, points to $3.5–4.0B of FY2026 operating cash flow. After capex of approximately $2.5B (a level the company has explicitly guided down from the prior $3.0B+ range), free cash flow recovers to approximately $1.0–1.5B by year-end run rate. The dividend coverage normalizes through 2026 and becomes comfortably covered by 2027.
The balance sheet trajectory. Dow ended Q1 2026 with $4.27B of cash and short-term investments against $19.6B of total debt, for net debt of approximately $15.3B. Total liquidity of approximately $14B (including undrawn revolver capacity) provides substantial cushion. The 4.0x leverage ratio is elevated for the trough year but will compress mechanically as EBITDA recovers — at $9B run-rate EBITDA exiting 2026, the leverage ratio falls to approximately 1.7x, well within the company's stated 2.0–2.5x target range. The Baa2/BBB credit rating is at the boundary of investment grade, and continued operational improvement should restore the rating outlook to stable.
The buyback potential. Dow's current capital allocation policy prioritizes dividend maintenance and debt reduction, with buybacks deferred until leverage normalizes. By late 2026 or early 2027, assuming the operational recovery proceeds as guided, the company will have capacity to resume buybacks at what would likely still be discounted equity valuations. Buybacks at $40–45 per share against a fair value of $50+ would be highly accretive to per-share intrinsic value.
Where that leaves the dividend. The bear case argues the dividend may be cut further. The forensic analysis argues the cycle history points the opposite direction — cycle-trough cuts are typically followed by multi-year reset-and-grow paths, and the current Dow dividend is positioned for the same trajectory. The 4.1% current yield is supported by the recovery roadmap rather than dependent on cycle-bottom cash flow, and provides total-return downside protection while the operational recovery proceeds.
Sum-Of-The-Parts Valuation — What Dow Is Actually Worth
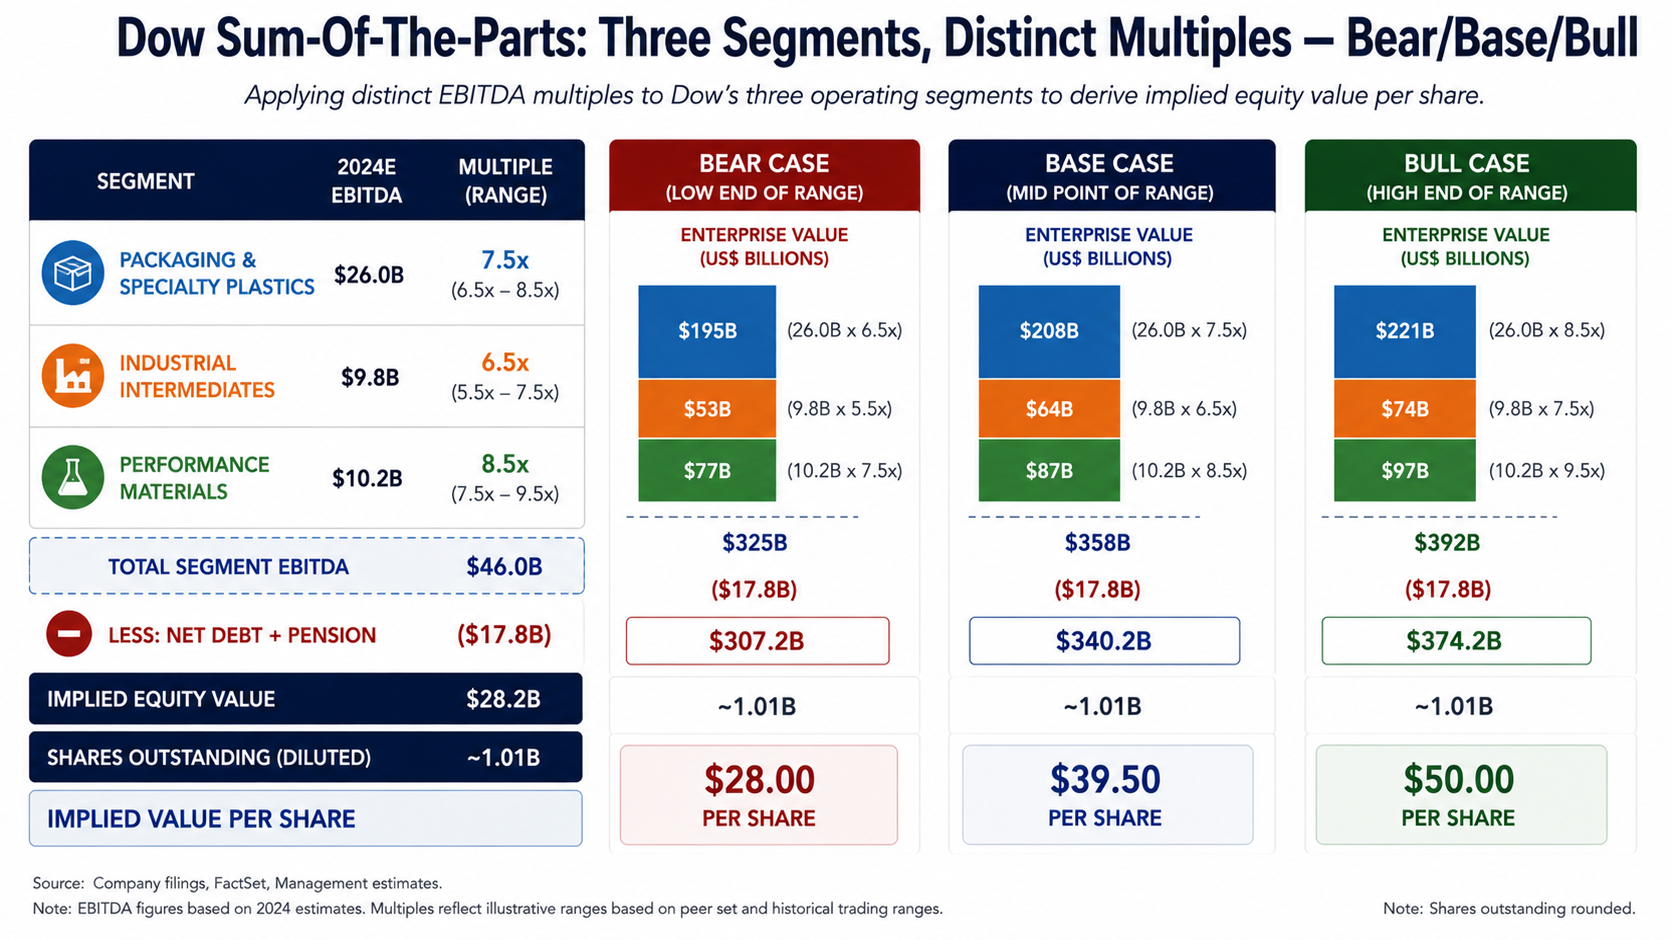
Most analysts apply a single mid-cycle EBITDA multiple to consolidated Dow. That treats three economically distinct segments — Packaging & Specialty Plastics, Industrial Intermediates & Infrastructure, and Performance Materials & Coatings — as one undifferentiated commodity-chemical business. A sum-of-the-parts framework does a better job of capturing the segment-level differences.
Segment 1: Packaging & Specialty Plastics. The largest segment, representing approximately 50% of Dow's revenue and 55% of normalized EBITDA. This segment serves packaging (food, consumer goods), industrial applications, and infrastructure markets. The competitive position is strong globally (top-3 polyethylene producer worldwide), with significant US Gulf Coast feedstock cost advantage. Normalized mid-cycle EBITDA of approximately $3.5B at a 7.5x multiple values the segment at $26B. Stress to 7.0x and it's still $24.5B.
Segment 2: Industrial Intermediates & Infrastructure. Approximately 30% of revenue and 25% of normalized EBITDA. The segment includes polyurethanes, propylene oxide, ethylene oxide derivatives, and chlor-alkali products serving industrial customers across construction, automotive, and durable goods. The competitive position is more mixed, with some commoditized exposure. Normalized mid-cycle EBITDA of approximately $1.5B at a 6.5x multiple values the segment at $9.8B.
Segment 3: Performance Materials & Coatings. Approximately 20% of revenue and 20% of normalized EBITDA. The segment includes silicones, coatings, and specialty materials with higher-margin specialty positions. The competitive position is strong, particularly in silicones where Dow is a top-3 global producer. Normalized mid-cycle EBITDA of approximately $1.2B at an 8.5x multiple (premium for specialty positioning) values the segment at $10.2B.
Net debt and pension. Dow ended Q1 2026 with net debt of $15.3B and net pension obligations of approximately $2.5B (the pension is a meaningful liability that should be deducted separately). Combined deduction: $17.8B.
The arithmetic. Base-case enterprise value sums to $26B (Packaging) + $9.8B (Industrial Intermediates) + $10.2B (Performance Materials) = $46B. Subtract $17.8B of net debt and pension, and equity value is approximately $28.2B, or roughly $39.50 per share on 717M shares outstanding. That's modestly above the current $33.63 price. Apply the European rationalization upside (Forensic #1) by raising the Packaging segment EBITDA to $3.9B at the same multiple, and segment value rises to $29.3B, lifting equity to $31.5B or $44 per share. Add the cost-program flow-through (Forensic #2) by raising Industrial Intermediates EBITDA to $1.7B and Performance Materials to $1.4B, and equity rises to $36B or $50 per share.
The 12-month price target of $44 reflects the base-case SOTP closing toward fair value as the Q2 2026 print validates the $2.2B operating-earnings guidance and the European rationalization begins to land in financial results. The multi-year intrinsic value of $52+ assumes the cost program reaches its full $1.2B run-rate target, the European supply rationalization persists through the 2027–2028 capacity additions, and the dividend follows the 2009-analog reset-and-grow trajectory. RBC's $51 high target is consistent with the bull case.
The Quiet US Feedstock Advantage Floor — A Structural Cost Position Most Investors Miss
The feature of DOW that you do not see in the sell-side work, but which I believe does substantial work to compress the downside in the stock, is the US Gulf Coast feedstock cost position. Approximately 75% of Dow's production capacity is in North America, with significant concentration in the US Gulf Coast region where natural gas liquids (NGLs — ethane, propane, butane) provide the cost-advantaged feedstock for ethylene cracking. The structural cost gap between US NGL-based ethylene production and European naphtha-based production is typically 200–400 basis points of EBITDA margin in normal cycle conditions, and widens further when oil prices are elevated relative to natural gas (the current macro environment).
The math. US ethane prices have remained in the $0.20–0.30 per gallon range through 2026, while European naphtha has traded at $600–700 per metric ton (oil-linked). The relative cost advantage has narrowed slightly versus the 2022 peak but remains structurally favorable for US-based producers. Dow's North American asset base is essentially captive to this advantage — the US shale-gas production economics are not going to deteriorate materially in the next decade given proven reserves and Permian Basin infrastructure investments.
The cycle resilience. During the 2018–2019 trough (when Dow EBITDA fell to approximately $4.5B), the US-based assets remained profitable on a cash basis while European competitors operated at or near cash break-even. The same dynamic is playing out in the current cycle — Dow's US Gulf Coast operations are generating positive cash flow even at the trough margins, supporting the dividend and the cost-program reinvestment. The European rationalization Dow is executing essentially harvests the cost advantage by removing the loss-making European footprint while preserving the US growth platform.
Short interest dynamics. Dow's short interest declined from 33.25M shares in early 2026 to 28.44M shares by mid-2026 (approximately 3.7–4.5% of shares outstanding) — modest in absolute terms but trending lower, suggesting that the cyclical-recovery thesis is being progressively accepted by the sophisticated short community. This is not a squeeze setup, but the falling short interest aligns with the bullish operational data.
In plain English, DOW is operating as a US feedstock-advantaged commodity-chemicals platform but pricing itself as a structurally challenged global cyclical. The multiple is a discount for the European exposure that's now being rationalized; the buyers at the margin who will set the floor are mostly uninterested in the European overhang — they're focused on the US Gulf Coast cost position, the cost-program execution, and the cycle-trough dividend reset. The bid floor structure is similar in concept to the structural-advantage arguments at PFE (income reliability) and CAG (multi-generation income), with the additional cyclical-recovery accelerant that doesn't exist at the consumer staples names.
Risks: What Would Break The Thesis
If three things happened, I would change my mind about DOW, and that's a legitimate thesis — one that can be falsified.
First, the Q2 2026 operating-earnings guidance of $2.2B is not achieved. The July 23, 2026 Q2 print is the central test of the operational recovery thesis. If Q2 operating EBITDA comes in materially below the $2.2B guide (say, below $1.7B), the inflection narrative is damaged and the cycle-trough may extend longer than the bull case assumes. The disappointing print would suggest either (a) volume recovery is slower than expected, or (b) margin recovery is being compressed by additional input cost pressure, or (c) the cost program is not flowing through as scheduled. Track the Q2 operating EBITDA result against the $2.2B guide directly — a meaningful miss would warrant a price-target cut to $36–38.
Second, an additional dividend cut. While the cycle history supports the dividend stability case, an unexpected operational setback (major outage, environmental incident, customer-loss event) could pressure operating cash flow below the $1.0B annual dividend obligation. The probability is low but not zero. A further dividend cut would damage the structural buyer base and trigger income-fund selling, with the stock potentially testing the $24–26 range before stabilizing. Track quarterly operating cash flow against the $250M quarterly dividend obligation; two consecutive quarters of below-coverage cash flow would warrant a defensive position adjustment.
Third, 2027–2028 capacity additions in China and the Middle East exceed the European rationalization. The bull thesis assumes a net-neutral capacity balance globally. If the new capacity coming online is meaningfully greater than the European removal (say, 8M+ tons of net additions against 6M tons of European removal), the global supply-demand balance loosens and mid-cycle margins compress below the levels the SOTP assumes. The bear case becomes increasingly credible if industry data through 2027 shows global polyethylene operating rates failing to recover above 88–90%. Track the IHS Markit / S&P Global capacity balance reports quarterly and adjust the model accordingly.
Other risks worth noting but not thesis-breaking: a sharp recession in 2026–2027 that reduces global chemical demand by 3%+ year-over-year would delay the recovery timeline by 4–6 quarters. Regulatory pressure on PFAS chemicals or other environmental compliance costs could compress margins in the Performance Materials segment. Trade-policy escalation (tariffs on chemical imports/exports) could disrupt the global supply chain. These are macro-level risks that affect the industry generally and don't preferentially damage Dow relative to peers.
Conclusion and Investment Recommendation
Dow is a cyclical-trough recovery setup where three independent analytical signals point positive against the structural-oversupply bear narrative. The European rationalization is removing supply permanently in a way the Bank of America $27 target doesn't fully credit — 6–8M tons of cumulative European capacity removal offsets a substantial portion of the 2027–2028 capacity additions. The cost program is delivering at run-rate — $193M Q1 savings on track to $1.2B run-rate by end-2026, providing $1.50–1.70 of additional mid-cycle EPS. The dividend has already been reset at the cycle trough, and the 2009 analog shows chemical-company dividend cuts at cycle troughs typically lead to multi-year reset-and-grow trajectories. Each of these three is individually testable, and each will produce key evidence in the next two to four quarters that proves or discredits the thesis.
If it is just the cycle recovery, it's compelling. The Q2 2026 operating-earnings guidance of $2.2B against the $873M Q1 print is a 150% sequential improvement that consensus models haven't fully built in. The July 23, 2026 earnings release is the central catalyst — a print at or above $2.2B validates the recovery and likely produces sharp re-rating; a print below $2.0B challenges the thesis but doesn't break it given the cost-program tailwind and the European rationalization timing. The 4.1% dividend yield provides ~4 points of downside protection through any cyclical noise, and the US Gulf Coast feedstock advantage ensures Dow generates positive cash flow even in trough conditions.
Net of all this, purchasing DOW here is a cyclical-recovery setup with three separate forensic catalysts converging on the next two quarterly prints. The multiple is a discount for the European overhang and the 2025 dividend cut; the operational data shows both being progressively resolved. Rating: BUY. 12-month price target: $44. Multi-year intrinsic value: $52+.

Sandeep Gupta
Independent equity research analyst publishing forensic theses on US-listed stocks. MBA, Politecnico di Milano (Milan, Italy).
Get new research in your inbox
Subscribe to receive forensic equity research the moment it's published. Free, no spam.
Related Research
 STLA
STLA Stellantis Trades Below Its Industrial Cash Balance — The Market Is Pricing 14 Car Brands At Zero (STLA)
 BA
BA Boeing Out-Delivered Airbus For The First Time Since 2019 — The Production Ramp Math Says $275 (BA)
 O
O
Discussion
Be the first to comment.